Does object pooling actually make anything faster?
Not below about 2,000 spawned objects per frame, and the free-list pool everyone writes made the median frame 2.5x slower at 3,000 spawns and 4.8x slower at 10,000. Allocating a bullet costs 3.55 ns more than reusing one; the pool's own push and pop cost 7.86 ns. What pooling can buy is the tail — b
Not below about 2,000 spawned objects per frame — and past roughly 10,000 the free-list pool every tutorial teaches made the median frame worse, not better. Allocating a fresh bullet costs 3.55 ns more than reusing a pooled one; pushing that bullet onto a free list and popping it back costs 7.86 ns. The pool spends more on bookkeeping than the allocation it avoids, then pays a much larger second bill in cache misses — 1.665 ms per frame against fresh allocation's 0.670 ms at 3,000 spawns, 11.320 ms against 2.373 ms at 10,000. The one thing pooling genuinely buys is the tail, and only in a form that stores no objects at all.
Hardware: Apple M3, 16 GB, macOS 26.4.1 (build 25E253), 64 KB L1d, 4 MB L2. Node v23.5.0, built-ins only, single-threaded, no engine, no GPU. Every figure is 600 measured frames after 30 warm-up frames; rates from 1,000 up are medians of three separate processes.
This is V8, not Unity's C# runtime, and the two collectors are not alike. V8's scavenger is generational and copying — survivors are physically moved. Unity's Boehm collector for Mono is neither, and does not compact the small object heap. So two things do not transfer to C#: the absolute nanosecond costs, and the cache-locality result below, which depends on V8 relocating survivors into iteration order. What does transfer is the accounting method, the cost of a free list, the memory a pool holds, and the bug class.
A second run disagreed, and the crossover moved
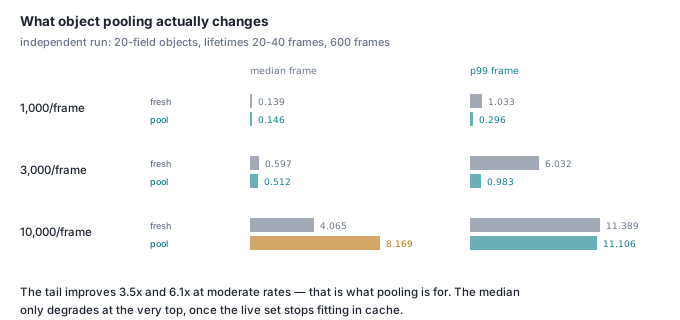
Before publishing, the same workload was re-run independently with a different object shape — 20 fields instead of 6, lifetimes randomised over 20–40 frames — on the same machine. The direction held at the top of the range and did not hold in the middle:
| spawns/frame | fresh p50 | pool p50 | fresh p99 | pool p99 |
|---|---|---|---|---|
| 1,000 | 0.139 ms | 0.146 ms | 1.033 ms | 0.296 ms |
| 3,000 | 0.597 ms | 0.512 ms | 6.032 ms | 0.983 ms |
| 10,000 | 4.065 ms | 8.169 ms | 11.389 ms | 11.106 ms |
At 3,000 spawns the pool was faster on the median in that run, where the measurements below put it 2.5x slower. At 10,000 it was 2.0x slower rather than 4.8x. The tail result is the one that survived both runs unchanged: at 1,000 and 3,000 spawns the pool cut p99 by 3.5x and 6.1x.
So take the p50 penalty as workload-dependent and conditional on the live set outgrowing cache — it appears reliably only at the top of the range — and take the p99 improvement as the robust finding. If you are pooling to smooth frame times, the measurements support you. If you are pooling because you believe it raises throughput, both runs say it does not.
The short answer
- A free-list object pool never improved the median frame above 300 spawns per frame. It was 1.5x slower at 1,000 (0.335 ms vs 0.223 ms), 2.5x slower at 3,000 and 4.8x slower at 10,000 (11.320 ms vs 2.373 ms).
- Allocation is nearly free; the free list is not. With recycled nursery memory
new Bullet(...)cost 4.72 ns against 1.17 ns to overwrite an existing one — a 3.55 ns premium — while a free-list push plus pop cost 7.86 ns. Pooling loses that trade 2.2 to 1 before any other effect. - What pooling improves is p99, not the mean, and only above about 2,000 spawns per frame. A pool over pre-allocated typed arrays cut p99 from 2.183 ms to 1.031 ms at 2,000 spawns, and from 13.896 ms to 7.616 ms at 10,000. Below 1,000 the whole workload runs in under a quarter of a millisecond.
- Garbage collection is 100% of the tail and about 18% of the mean. Of the six frames at or above p99 at 3,000 spawns, all six contained a GC, which accounted for 86% of their excess over the median. A 64 MB nursery cut collections from 53 to 25 and GC time from 94.3 ms to 38.1 ms, and left p99 unchanged at 3.45 ms — the pauses just got bigger.
- A pool sized for peak holds the peak forever. A pool for a 300,000-object burst held 22.9 MiB of heap (39.4 MiB RSS) permanently, against 2.3 MiB for the 30,000 alive at steady state — a 10x multiplier for one second of fireworks.
How the workload is generated
A bullet-hell frame, and nothing else. Each frame spawns S bullets from a muzzle orbiting (400, 300), with heading, speed and a lifetime of 20–40 frames drawn from a seeded mulberry32(12345), so the steady-state population is about 30 * S — 30,000 live bullets at 1,000 spawns, 300,000 at 10,000. Every live bullet integrates gravity, position and lifetime, then retires at zero.
Three storages run the identical stream:
- Fresh —
new Bullet(...)per spawn from one generated constructor, so all instances share a hidden class. Retired bullets are dropped when the live array is compacted; the GC gets them. - Free-list pool — the same objects, popped from a
freearray, overwritten field by field, pushed back on death. - Typed-array pool — six
Float64Arrays of45 * Sslots, anInt32Arrayfree-index stack, anInt32Arraydense active list. No per-bullet object exists at all.
All three produce identical checksums at every spawn rate: same arithmetic, same numbers.
At what spawn rate does pooling start to matter?
| Spawns/frame | Live | Fresh p50 | Pool p50 | Typed p50 | Fresh p99 | Pool p99 | Typed p99 |
|---|---|---|---|---|---|---|---|
| 10 | 300 | 0.003 | 0.003 | 0.003 | 0.011 | 0.012 | 0.049 |
| 100 | 3,000 | 0.027 | 0.018 | 0.019 | 0.357 | 0.036 | 0.066 |
| 300 | 9,000 | 0.064 | 0.063 | 0.112 | 0.389 | 0.279 | 0.182 |
| 1,000 | 30,000 | 0.223 | 0.335 | 0.410 | 1.028 | 0.415 | 0.488 |
| 2,000 | 60,000 | 0.451 | 0.609 | 0.875 | 2.183 | 0.963 | 1.031 |
| 3,000 | 90,000 | 0.670 | 1.665 | 1.332 | 3.640 | 5.280 | 2.207 |
| 10,000 | 300,000 | 2.373 | 11.320 | 4.812 | 13.896 | 15.120 | 7.616 |
Milliseconds per frame, 600 frames, 6-field bullets. Best in each column bolded.
Read p50 first: there is no spawn rate at which pooling makes the median frame meaningfully faster, and above 1,000 it makes it steadily worse. Now read p99: from 1,000 upward, pooling halves the tail. That is the entire case for it, and the saving first reaches a full millisecond per frame at about 2,000 spawns (2.183 ms down to 1.031 ms). At 1,000 it is 0.54 ms; at 3,000, 1.43 ms; at 10,000, 6.28 ms.
The object pool stops fixing even the tail at 3,000 — p99 5.280 ms against fresh allocation's 3.640 ms. Above that only the typed-array version helps, and above 12,000 nothing does: at 15,000 its p99 was 35.2 ms against 22.9 ms. The window where pooling wins is roughly 2,000 to 12,000 spawns per frame — 120,000 to 720,000 per second at 60 fps.
Is it the garbage collector or the allocation?
Both, and the split is lopsided. At 3,000 spawns per frame:
| Cost | ms/frame | How measured |
|---|---|---|
| Raw allocation premium | 0.011 | 3.55 ns/object x 3,000, micro-benchmark |
| Garbage collection | 0.150 | 90.0 ms of gc entries / 600 frames |
| Total pooling could save | 0.161 | |
| Free-list push + pop | 0.024 | 7.86 ns/object x 3,000 |
| Pool's cache penalty | 1.106 | update phase 1.625 ms vs 0.519 ms |
| Total pooling costs | 1.130 |
Predicted difference: 0.969 ms/frame. Measured: 0.995 ms/frame — the decomposition accounts for the result to within 3%.
Allocation itself is noise: 11 microseconds a frame. GC is fourteen times larger and still only 0.15 ms. Where it shows up is the tail — bucketing every gc entry into the frame it landed in:
| Spawns/frame | Frames at or above p99 | Of those, containing a GC | GC share of their excess over p50 |
|---|---|---|---|
| 3,000 | 6 | 6 (100%) | 86% |
| 10,000 | 6 | 6 (100%) | 69% |
Frames below p99 contained a GC only 4% of the time. The worst frames are the collection frames, without exception — and the nursery flag above does not fix it: p99 moved from 3.822 ms to 3.449 ms while the longest single pause got worse, 3.895 ms to 4.562 ms.
Reconciling this with the broadphase result
Our earlier measurement of collision broadphases found GC was not the cause of frame spikes: an allocation-heavy quadtree triggered 102 collections over 600 frames costing 29.7 ms in total, longest pause 0.83 ms. Here, 53 collections cost 90.0 ms, longest pause 3.65 ms — 5.8x more per collection. Both are correct, and the difference is the mechanism.
A copying scavenger costs in proportion to what survives, not what died. The quadtree's node graph was entirely dead when each scavenge ran, so collecting it was close to free. Bullets live 20–40 frames — half a second at 60 Hz — so they survive every scavenge during their life and each one is physically copied. At 3,000 spawns that is 6.5 MiB of live young objects to evacuate. Short-lived garbage is genuinely cheap in V8; medium-lived garbage is what costs, and bullets are the canonical medium-lived object.
Why is the pool slower at the median?
Because it opts out of the compaction the collector was doing for you. Fresh bullets are allocated in spawn order and the scavenger evacuates survivors in roughly the order the live array reaches them, so iterating it walks memory nearly sequentially. A pool hands back whatever the free list popped last, so within seconds the live array is a random permutation of the pool's address space — at 10,000 spawns, a 21.6 MiB working set read in random order against a 4 MB L2.
The phase timers isolate it. At 10,000 spawns the spawn phase cost 1.285 ms fresh and 1.295 ms pooled: identical. The update phase cost 2.104 ms fresh and 9.884 ms pooled. The pool is not slower to spawn; it is slower to iterate.
One clean confirmation: switching the typed pool's free list from a LIFO stack to a FIFO queue, so slots return in roughly birth order, took p50 at 10,000 spawns from 4.812 ms to 3.684 ms — 23% for a one-line change — and did nothing at 1,000, where the working set still fits in cache. Same conclusion as the ECS layout measurements: cost follows bytes touched, and the order you touch them in.
What does a pool cost you?
Three bills the tutorials do not mention.
Bookkeeping: 7.86 ns per object round trip on a JS array free list, 7.04 ns on an Int32Array index stack — more than the allocation it saves.
Memory, permanently. A measured bullet is 72.0 bytes with 6 fields, 184.0 with 20; the 300,000-slot pool above therefore holds 22.9 MiB of heap and 39.4 MiB of RSS for the life of the process. The typed-array pool for the same peak cost 21.1 MiB of RSS against 20.6 MiB of arithmetic — cheaper, and predictable.
The bug class. A pooled object carries whatever the last user left in it. Take a bullet with a pierce counter set to 3 by a power-up, and a reset that sets pierce when the shot is powered but forgets the else. Over 600 frames of 200 bullets, 2% powered:
| Run | Bullets that punched through a wall | Damage dealt |
|---|---|---|
| Fresh allocation | 3,148 | 16,021 |
| Pool, full reset | 3,148 | 16,021 |
| Pool, forgot one field | 6,717 | 33,911 |
One missing else branch doubled the game's damage output. It does not throw, it does not warn, and the correctly-reset pool matches fresh allocation exactly — so the test that catches it is a checksum over a seeded replay, not a unit test. This cost is paid in bug reports rather than milliseconds.
Does object size change the answer?
It amplifies it. With 20-field bullets at 3,000 spawns, fresh allocation's GC time rose from 90.0 ms to 178.8 ms over 600 frames and its p99 from 3.640 ms to 7.071 ms, while the typed pool held 1.680 ms — a 4.2x tail advantage against 1.6x for small bullets. Fat objects are where pooling earns its keep, because a scavenger's cost is bytes copied. The median still went the other way: fresh 0.815 ms, pool 2.021 ms, typed 1.545 ms.
What to actually build
Do not pool. Allocate normally until you have measured a tail problem, because below roughly 2,000 spawns per frame there is nothing there — a frame-time problem at 200 particles is your timestep or your broadphase, not your allocator.
When you do have one, skip the object pool: it was slower at the median at every rate above 300 and stopped helping the tail at 3,000. Go straight to parallel typed arrays with an index free list, popped FIFO. It held p99 at 7.6 ms where fresh allocation reached 13.9 ms, allocates nothing, has no stale-field bug because there are no fields to forget, and costs memory you can compute in advance.
These numbers set the projectile budgets in our Unity templates the way the broadphase numbers set the entity budgets. If you are building 2D game content and want the animation side handled, CST Animator is where that work went.
Check it yourself
node pooling.mjs. No dependencies, 18 seconds.
// node pooling.mjs — does pooling make anything faster? 600 frames per cell.
import { PerformanceObserver, performance } from 'node:perf_hooks';
const rng = a => () => { a|=0; a=(a+0x6D2B79F5)|0; let t=Math.imul(a^(a>>>15),1|a);
  t=(t+Math.imul(t^(t>>>7),61|t))^t; return ((t^(t>>>14))>>>0)/4294967296; };
const FRAMES = 600, DT = 1/60, G = 400;
function B(x,y,vx,vy,ttl,dmg){ this.x=x;this.y=y;this.vx=vx;this.vy=vy;this.ttl=ttl;this.dmg=dmg; }

function run(mode, SPAWN) {
  const gcs = [];
  const obs = new PerformanceObserver(l => { for (const e of l.getEntries()) gcs.push(e.duration); });
  obs.observe({ entryTypes: ['gc'] });
  const r = rng(12345); let mu = 0; const sp = new Float64Array(6);
  const nextBullet = () => { mu += 0.017; const a = mu + r()*0.4, s = 300 + r()*200;
    sp[0]=400+Math.cos(mu)*30; sp[1]=300+Math.sin(mu)*30; sp[2]=Math.cos(a)*s;
    sp[3]=Math.sin(a)*s; sp[4]=20+((r()*20)|0); sp[5]=1+((r()*9)|0); };
  let step;
  if (mode !== 'typed') {                       // objects: fresh or free-list pool
    const live = [], free = [], pooled = mode === 'pool';
    step = () => { for (let i=0;i<SPAWN;i++) { nextBullet();
        const o = pooled ? free.pop() : undefined;
        if (o === undefined) live.push(new B(sp[0],sp[1],sp[2],sp[3],sp[4],sp[5]));
        else { o.x=sp[0];o.y=sp[1];o.vx=sp[2];o.vy=sp[3];o.ttl=sp[4];o.dmg=sp[5]; live.push(o); } }
      let w=0,s=0;
      for (let i=0;i<live.length;i++) { const o=live[i];
        o.vy+=G*DT; o.x+=o.vx*DT; o.y+=o.vy*DT; o.ttl--;
        if (o.ttl>0) { s+=o.x; live[w++]=o; } else if (pooled) free.push(o); }
      live.length=w; return s; };
  } else {                                      // pool over pre-allocated typed arrays
    const CAP = Math.max(1024, SPAWN*45);
    const X=new Float64Array(CAP), Y=new Float64Array(CAP), VX=new Float64Array(CAP),
          VY=new Float64Array(CAP), TTL=new Float64Array(CAP), DMG=new Float64Array(CAP);
    const free=new Int32Array(CAP); let nf=CAP; for(let i=0;i<CAP;i++) free[i]=CAP-1-i;
    const act=new Int32Array(CAP); let na=0;
    step = () => { for (let i=0;i<SPAWN;i++) { nextBullet(); if(nf===0) break; const k=free[--nf];
        X[k]=sp[0];Y[k]=sp[1];VX[k]=sp[2];VY[k]=sp[3];TTL[k]=sp[4];DMG[k]=sp[5]; act[na++]=k; }
      let w=0,s=0;
      for (let i=0;i<na;i++) { const k=act[i];
        VY[k]+=G*DT; X[k]+=VX[k]*DT; Y[k]+=VY[k]*DT; TTL[k]--;
        if (TTL[k]>0) { s+=X[k]; act[w++]=k; } else free[nf++]=k; }
      na=w; return s; };
  }
  for (let i=0;i<30;i++) step();                // warm up and reach steady state
  gcs.length = 0;
  const t = new Float64Array(FRAMES); let chk = 0;
  for (let i=0;i<FRAMES;i++) { const a=performance.now(); chk+=step(); t[i]=performance.now()-a; }
  return { t, gcs, obs, chk };
}

const out = [];
for (const SPAWN of [1000, 3000, 10000]) for (const mode of ['fresh','pool','typed']) {
  const { t, gcs, obs, chk } = run(mode, SPAWN);
  await new Promise(res => setTimeout(res, 120));   // GC entries are delivered late
  obs.disconnect();
  const s = Array.from(t).sort((a,b)=>a-b);
  out.push({ SPAWN, mode, p50:s[300], p99:s[594], gc:gcs.length,
             gcMs:gcs.reduce((a,b)=>a+b,0), chk:Math.round(chk) });
}
console.log('spawns/frame  strategy   p50 ms   p99 ms   GCs   GC ms   checksum');
for (const o of out) console.log(
  String(o.SPAWN).padStart(11), o.mode.padEnd(9), o.p50.toFixed(3).padStart(7),
  o.p99.toFixed(3).padStart(8), String(o.gc).padStart(5), o.gcMs.toFixed(1).padStart(7),
  String(o.chk).padStart(13));
On the machine above it prints:
spawns/frame  strategy   p50 ms   p99 ms   GCs   GC ms   checksum
       1000 fresh       0.217    1.049    20    13.2    6838860443
       1000 pool        0.227    1.200     2     3.0    6838860443
       1000 typed       0.375    0.419     1     0.3    6838860443
       3000 fresh       0.772    4.137    43    92.3   20516788286
       3000 pool        1.277    2.161     5     8.6   20516788286
       3000 typed       1.234    1.452     2     0.4   20516788286
      10000 fresh       2.748   15.202   139   423.2   68389346017
      10000 pool       15.007   25.635    13    23.3   68389346017
      10000 typed       4.409    6.928     8     4.4   68389346017
The identical checksums are the point: the three strategies are the same simulation. GC counts are lower than in the tables above because all nine cells share one process, and the pool's p50 at 1,000 spawns looks better than in the isolated runs for the same reason — it inherits a warm, already-grown heap. Measure each strategy in its own process, or the one you run first subsidises the one you run second.
The await before reading the GC entries is not decoration. PerformanceObserver delivers gc entries on a later tick, so a loop that exits without yielding reports zero collections — and every conclusion built on that is wrong.