Does SELECT * actually hurt?
Measured on Postgres 16 at one million rows. SELECT * reads exactly the same buffers as a narrow select, costs nothing on a cached primary-key lookup, and then costs 5x warm and up to 700x cold the moment it steps off a covering index. EXPLAIN ANALYZE hides most of the bill.
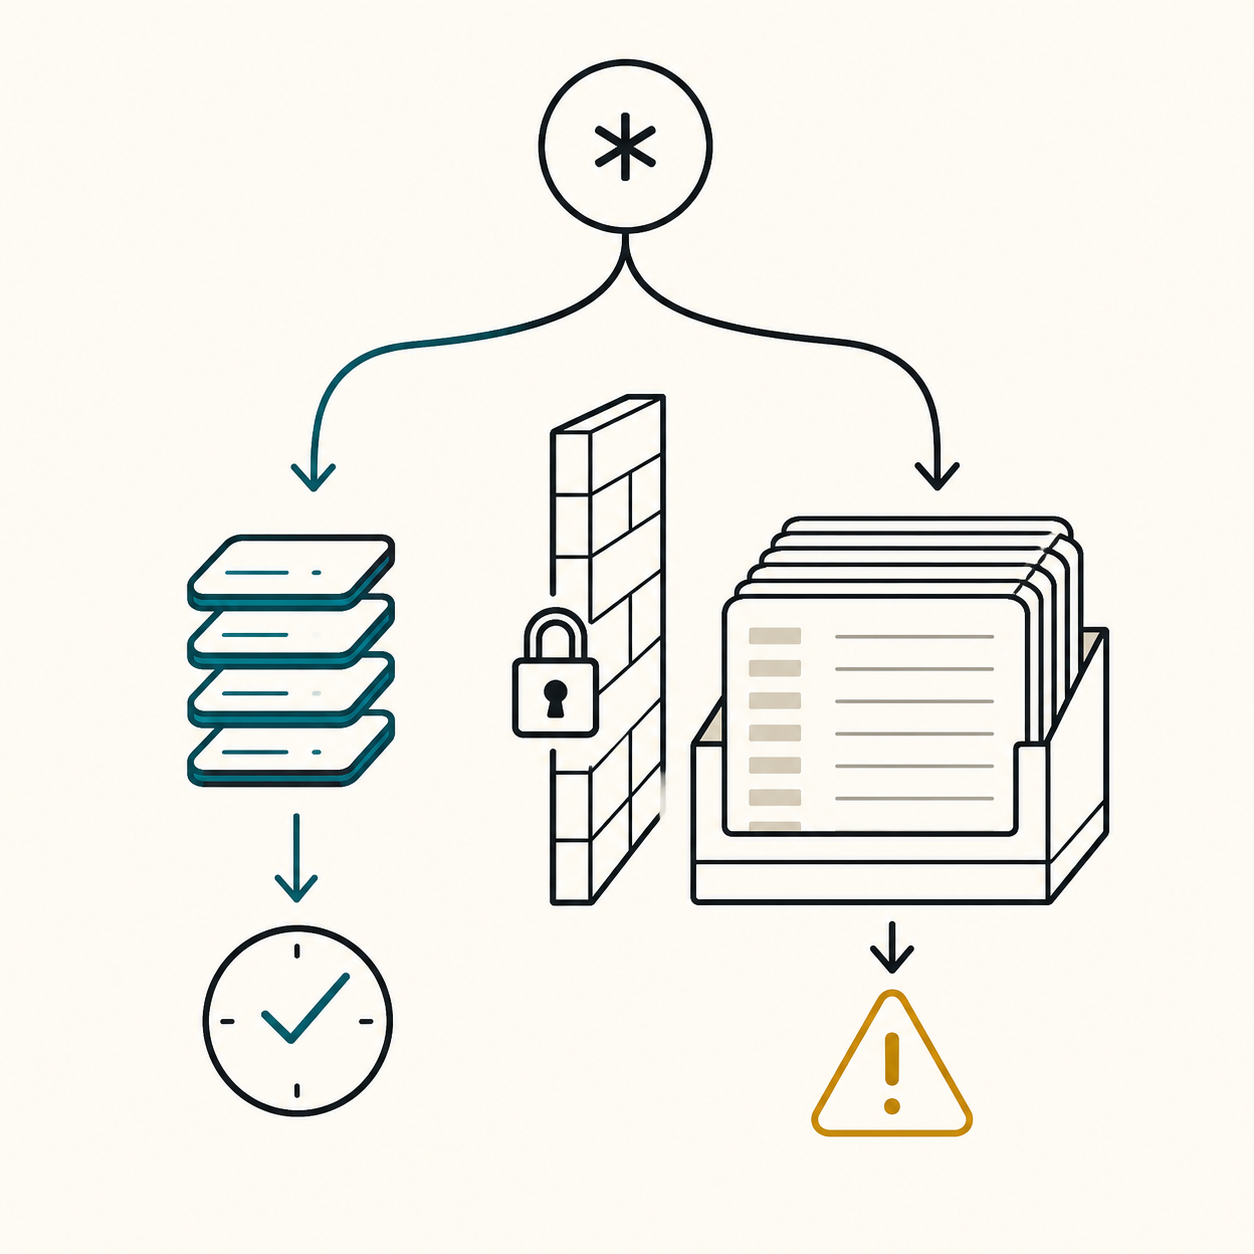
Almost never for the reason people give, and enormously for one reason they rarely mention: SELECT * throws away index-only scans. On Postgres 16 at one million rows, SELECT * and SELECT id, name over the same rows read exactly the same buffers and took the same time in EXPLAIN ANALYZE — 4,303 buffers and about 10 ms either way. But the same query answered by a covering index took 1.87 ms as an index-only scan and 9.6 ms warm as SELECT *, and when the heap was not cached, 6.6–48 ms against 2.0–12.0 seconds.
The short answer
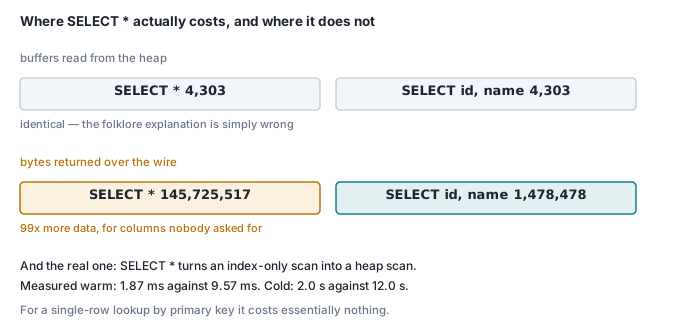
SELECT *does not read more pages from the heap. Postgres reads the whole row either way. On a 50,000-row range scan,SELECT *andSELECT id, nameboth reportedBuffers: shared hit=4303and both finished in about 10 ms underEXPLAIN (ANALYZE, BUFFERS).- The cost is serialization and transfer, and
EXPLAIN ANALYZEon Postgres 16 does not show it. The same 50,000 rows took 10 ms inEXPLAIN ANALYZEand 753–1,436 ms delivered to a real client, becauseEXPLAIN ANALYZEnever formats the rows. Verified withpg_statio_all_tables:EXPLAIN (ANALYZE) SELECT *over 2,000 TOASTed rows touched 0 TOAST blocks; actually reading the column touched 2,000. - On the wire it is 50x to 100x. 50,000 rows cost 1,478,478 bytes as
SELECT id, nameand 145,725,517 bytes asSELECT *— 30 bytes per row against 2,914. SELECT *defeats a covering index, and that is the expensive one. Same predicate, same 12,500 rows: 1.87–1.99 ms as anIndex Only ScanwithHeap Fetches: 0, 9.57–9.88 ms warm as aBitmap Heap Scan, and 2.0–12.0 seconds when the heap had to come off disk.- For a single-row lookup by primary key it is free. 0.079–0.087 ms narrow against 0.083–0.095 ms for
SELECT *on a table with no TOASTed column — inside the noise. With a 2.2 KB TOASTed column it becomes 0.122–0.134 ms: about 45 microseconds, still nothing.
What was measured, and on what
Postgres 16.15 in Docker (postgres:16, aarch64) on an Apple M3 laptop — 8 cores, 16 GB RAM, macOS 26.4.1, Docker 29.5.2, an 8 GB Docker VM, shared_buffers=128MB, max_wal_size=4GB, and max_parallel_workers_per_gather=0 so plans stayed comparable. These are indicative figures from a laptop in Docker, not a lab benchmark. Every timing was run at least three times and is reported as a range. The ratios are the point.
Two tables, 20 columns each, one million rows each, identical apart from how wide the notes column is:
CREATE TABLE t_toast (
  id bigint PRIMARY KEY, name text, email text, status text, country text,
  device text, region text, source text, amount numeric(10,2), qty int,
  score float8, attempts smallint, is_active bool, created_at timestamptz,
  updated_at timestamptz, ref_a uuid, ref_b uuid, tags text, notes text, meta jsonb);
CREATE TABLE t_flat (LIKE t_toast INCLUDING ALL);
t_toast got 2,208 characters of poorly-compressible hex in notes, which is over the 2 KB TOAST threshold, so Postgres moved it out of line. t_flat got 904 characters, which stays inline. Both got a 432-byte meta jsonb. After VACUUM ANALYZE:
t_flat |
t_toast |
|
|---|---|---|
| Average row | 1,515 bytes | 2,823 bytes |
| Heap | 1,563 MB (200,000 pages) | 651 MB (83,327 pages) |
| TOAST table | 8 KB (empty) | 2,604 MB + 43 MB index |
| TOAST chunks | 0 | 2,000,000 (2 per row) |
| Total | 1,584 MB | 3,320 MB |
Note what TOAST did to the heap: moving notes out of line made t_toast's main table less than half the size of t_flat's, though it holds more data. That matters later.
Does SELECT * read more from disk?
No. This is the first thing to get out of the way, because it is the reason most of the folklore is wrong.
Postgres reads a whole heap page and forms a whole tuple regardless of your target list. Fifty thousand rows by primary-key range, EXPLAIN (ANALYZE, BUFFERS, TIMING OFF), warm:
| 50,000 rows by PK range | buffers | Execution Time |
|---|---|---|
t_toast, SELECT id, name |
shared hit=4303 |
9.78 / 10.22 / 34.14 ms |
t_toast, SELECT * |
shared hit=4303 |
10.09 / 12.49 ms |
t_flat, SELECT id, name |
shared hit=10142 |
12.33 / 12.84 / 15.59 ms |
t_flat, SELECT * |
shared hit=10142 |
11.95 / 50.00 ms |
Byte-identical buffer counts. Not similar — identical. If your mental model of SELECT *'s cost is "it reads more from the table", delete it.
The t_flat row is the one to sit with: it reads 10,142 buffers to t_toast's 4,303 for the same 50,000 rows, because its rows are inline and its heap is 2.4x denser in bytes per row. The table without the TOASTed column does more IO.
Where does the cost actually appear?
At serialization. And EXPLAIN ANALYZE on Postgres 16 does not measure it, because it runs the plan and discards the rows without ever calling an output function. Postgres 17 added EXPLAIN (SERIALIZE) for exactly this blind spot; on 16 you have to measure from a client.
Same four queries, psql -o /dev/null over a Unix socket inside the container, so nothing but formatting and detoasting is added:
| 50,000 rows | EXPLAIN ANALYZE |
real client |
|---|---|---|
t_toast, SELECT id, name |
~10 ms | 15.5 / 17.6 / 23.4 ms |
t_toast, SELECT * |
~10 ms | 328.0 / 433.1 / 642.6 ms |
t_flat, SELECT id, name |
~12 ms | 17.7 / 25.9 / 30.9 ms |
t_flat, SELECT * |
~12 ms | 165.6 / 235.0 / 240.2 ms |
Thirty-three times the plan's reported execution time, on a query the plan says is identical. That gap is the article. If you are reading EXPLAIN (ANALYZE, BUFFERS) to find a slow query, this is the one class of cost it will not show you on Postgres 16.
How many bytes does SELECT * put on the wire?
I put a byte-counting TCP proxy between psql and the server and measured the server-to-client direction exactly. A bare SELECT 1 connection costs 681 bytes of handshake, so everything below is dominated by rows:
| 50,000 rows returned | bytes on the wire | per row | client time |
|---|---|---|---|
SELECT id, name (either table) |
1,478,478 | 29.6 B | 64–88 ms |
SELECT * on t_flat |
80,325,517 | 1,606 B | 334–653 ms |
SELECT * on t_toast |
145,725,517 | 2,914 B | 753–1,436 ms |
Byte counts reproduced exactly across two sittings — not to within a percent, to the byte. The wire is text format by default, so it is slightly larger than storage: a uuid is 36 characters instead of 16 bytes, a numeric is spelled out, and the 2,208-character notes costs 2,208 bytes.
Ninety-eight times the bytes for the same fifty thousand rows. If those rows are crossing a network rather than a loopback socket, that ratio is your latency and your egress bill, and no amount of index tuning touches it.
How much of the cost is TOAST?
Most of it, on a table that has one. And the mechanism is worth knowing: a TOASTed value is not read when the row is read. It is fetched, by a separate index lookup into the TOAST table, at the moment something asks for its contents — which for a plain SELECT means the output function.
Measured server-side over the same 50,000 rows, with nothing returned to the client:
t_toast, 50,000 rows, no rows returned |
time |
|---|---|
SELECT count(*) |
2.47 / 2.52 / 2.98 ms |
SELECT sum(length(name)) — inline column |
16.3 / 33.1 / 34.2 ms |
SELECT sum(length(notes)) — TOASTed column |
248.2 / 262.2 / 316.6 ms |
So roughly 215–283 ms of the 328–643 ms that SELECT * costs on this table is detoasting a column nobody asked for. On t_flat, whose notes is inline, the same sum(length(notes)) costs 58.7–140.8 ms — the whole difference is the trip to the TOAST table.
That laziness is also why EXPLAIN ANALYZE misses it. Counting TOAST blocks with pg_statio_all_tables across three statements over the same 2,000 rows:
| statement | TOAST blocks touched |
|---|---|
EXPLAIN (ANALYZE) SELECT * FROM t_toast WHERE id BETWEEN 1 AND 2000 |
0 |
SELECT count(*) FROM (SELECT * FROM t_toast WHERE id BETWEEN 1 AND 2000) x |
0 |
SELECT sum(length(notes)) FROM t_toast WHERE id BETWEEN 1 AND 2000 |
2,000 |
Wrapping SELECT * in a count(*) — a common way to "benchmark" a query without printing it — measures nothing at all on a TOASTed table. Neither does EXPLAIN ANALYZE. Both report a fast query that is not fast.
Does SELECT * defeat a covering index?
Yes, completely, and this is the cost worth reorganising code over.
I added CREATE INDEX ix_cov ON … (country, amount) to both tables — 30 MB each — and vacuumed until the visibility map showed 100% all-visible, so index-only scans were fully available. The predicate country='DE' AND amount BETWEEN 100 AND 200 matches 12,500 rows.
12,500 rows, t_flat |
plan | buffers | warm | cold |
|---|---|---|---|---|
SELECT country, amount |
Index Only Scan, Heap Fetches: 0 |
7,551 | 1.87 / 1.88 / 1.99 ms | 48.1 / 33.5 / 9.6 ms |
SELECT * |
Bitmap Heap Scan |
12,551 | 9.57 / 9.58 / 9.88 ms | 12,014 / 2,951 / 2,029 ms |
Same rows, same index, same predicate. Adding columns you do not need to the target list changed the plan from one that never touches the table to one that visits 12,500 scattered heap pages. Warm, that is 5.1x. Cold — with Postgres restarted and the VM's page cache dropped before each run — it is 88x to 250x, and on t_toast one cold run of the same shape took 20.5 seconds against 44 ms for the covered query.
The cold spread is wide, because caching underneath a Docker VM is not something a laptop controls. Do not quote 250x. Quote the shape: an index-only scan is bounded by one index; SELECT * is bounded by random IO across the whole table, and on a TOASTed table across the TOAST table too.
This is also the answer to "but we only select a few thousand rows". The bytes argument scales with rows; this one does not care. It is a plan change.
Does it matter for a single-row lookup by primary key?
No. This is the case people worry about most and it is the one where SELECT * is genuinely free.
pgbench, one client, 15 seconds per run, random primary key over a cached 100,000-row working set:
| single-row lookup by PK | latency | tps |
|---|---|---|
t_flat, SELECT id, name |
0.079 / 0.080 / 0.087 ms | 11,439–12,648 |
t_flat, SELECT * |
0.083 / 0.082 / 0.095 ms | 10,546–12,248 |
t_toast, SELECT id, name |
0.085 / 0.084 / 0.099 ms | 10,138–11,859 |
t_toast, SELECT * |
0.134 / 0.122 / 0.130 ms | 7,437–8,181 |
On the table with no TOASTed column the difference does not survive the noise. On the TOASTed table SELECT * costs about 45 microseconds — one extra TOAST index lookup and two chunk reads — which is a 1.5x ratio and an irrelevant absolute number unless you are serving ten thousand of these a second.
I also tried to measure this cold, over the full million rows with caches dropped. It produced 0.640 ms and 1.163 ms for SELECT * against 0.605 ms and 0.375 ms narrow: no signal, just IO noise, so there is no number here to quote.
What is the cost that is not about performance?
Result shape. SELECT * means "whatever columns this table has today", and that is a promise your schema is free to break:
--- SELECT * before the migration ---
 id | name |      email
----+------+-----------------
  1 | ada  | ada@example.com

--- SELECT * after two ADD COLUMNs, same query text ---
 id | name |      email      | password_hash |      internal_notes
----+------+-----------------+---------------+---------------------------
  1 | ada  | ada@example.com | x$2b$argon    | do not ship to the client
Nothing failed. No error, no warning, no code change. A migration two teams away added a column and every SELECT * in the codebase started returning it — into your JSON serializer, your log lines, your API response. In a join the same statement returns two columns called id and two called name, and which one your driver hands you is the driver's business, not yours.
This is the argument that survives every measurement above, including the ones where SELECT * was free. It is also why the rule is stated as an absolute: "name your columns" is easy to follow, and "name your columns unless the row is small and cached and you are not relying on a covering index" is not.
So when does SELECT * actually hurt?
Three cases, in order of how much they cost.
It defeats a covering index. If a query could be answered by an index alone, adding unused columns turns a bounded index scan into scattered heap IO — 5x warm, two to three orders of magnitude cold. It shows up as a production incident, and it is invisible in the plan you tested in staging on a warm cache.
It multiplies bytes on the wire. 30 bytes a row against 2,914 on this schema. That is 98x of network, driver allocation and serialization for data you discard, and it grows linearly with rows returned.
It detoasts large values you never asked for. On a table with a 2 KB column — a captured payload, a document, a jsonb blob you write once and read whole — that was 215–283 ms per 50,000 rows here, and it is the part no profiling tool on Postgres 16 will attribute correctly.
And where it does not hurt: reading a whole row you are going to use, and single-row lookups by key. Those cost nothing measurable. The reason to name your columns there is the migration, not the microseconds.
Check it yourself
About two minutes, one container, nothing installed. This builds a 120,000-row table with the same 20-column shape and shows the covering-index effect, the byte ratio, and the proof that EXPLAIN ANALYZE never touches TOAST:
docker run -d --name cite-star-demo -p 55603:5432 \
  -e POSTGRES_PASSWORD=demo -e POSTGRES_DB=bench postgres:16 \
  -c max_parallel_workers_per_gather=0
until docker exec cite-star-demo pg_isready -U postgres -d bench >/dev/null 2>&1; do sleep 1; done

docker exec -i cite-star-demo psql -U postgres -d bench -q <<'SQL'
CREATE TABLE base AS SELECT string_agg(md5(random()::text),'') AS s FROM generate_series(1,220);
CREATE TABLE t (
  id bigint PRIMARY KEY, name text, email text, status text, country text,
  device text, region text, source text, amount numeric(10,2), qty int,
  score float8, attempts smallint, is_active bool, created_at timestamptz,
  updated_at timestamptz, ref_a uuid, ref_b uuid, tags text, notes text, meta jsonb);
INSERT INTO t
SELECT g, 'user_'||g, 'user_'||g||'@example.com',
       (ARRAY['pending','paid','shipped'])[1+(g%3)],
       (ARRAY['US','GB','DE','FR','VN','JP','BR','IN'])[1+(g%8)],
       'web','emea','ads', round((g%100000)/100.0,2), g%97, (g%1000)/7.0, g%5, g%2=0,
       now(), now(), md5(g::text)::uuid, md5((g+1)::text)::uuid, 'tag'||(g%50),
       substr(b.s, 1+(g%4000), 2208),
       jsonb_build_object('src', g%9, 'blob', substr(b.s, 1+(g%3000), 380))
FROM generate_series(1,120000) g, base b;
CREATE INDEX ix_cov ON t (country, amount);
VACUUM ANALYZE t;
SQL

Q="country='DE' AND amount BETWEEN 100 AND 600"
docker exec -i cite-star-demo psql -U postgres -d bench \
  -c "EXPLAIN (ANALYZE, BUFFERS, COSTS OFF) SELECT country, amount FROM t WHERE $Q;" \
  -c "EXPLAIN (ANALYZE, BUFFERS, COSTS OFF) SELECT * FROM t WHERE $Q;" \
  -c "COPY (SELECT country, amount FROM t WHERE $Q) TO PROGRAM 'wc -c > /tmp/a';" \
  -c "COPY (SELECT * FROM t WHERE $Q) TO PROGRAM 'wc -c > /tmp/b';"
echo -n "  indexed columns only: "; docker exec cite-star-demo cat /tmp/a
echo -n "  SELECT *            : "; docker exec cite-star-demo cat /tmp/b

docker exec -i cite-star-demo psql -U postgres -d bench -q -t <<'SQL'
SELECT pg_stat_reset(); SELECT pg_sleep(1);
EXPLAIN (ANALYZE, COSTS OFF, TIMING OFF) SELECT * FROM t WHERE id BETWEEN 1 AND 2000;
SELECT pg_stat_force_next_flush();
SELECT 'toast blocks after EXPLAIN ANALYZE: ' || (heap_blks_hit+heap_blks_read)
FROM pg_statio_all_tables WHERE relid=(SELECT reltoastrelid FROM pg_class WHERE relname='t');
SELECT pg_stat_reset(); SELECT pg_sleep(1);
SELECT sum(length(notes)) FROM t WHERE id BETWEEN 1 AND 2000;
SELECT pg_stat_force_next_flush();
SELECT 'toast blocks after really reading the column: ' || (heap_blks_hit+heap_blks_read)
FROM pg_statio_all_tables WHERE relid=(SELECT reltoastrelid FROM pg_class WHERE relname='t');
SQL

docker rm -f cite-star-demo
A run of that on a fresh container printed:
== plan: only the indexed columns ==
 Index Only Scan using ix_cov on t (actual time=0.029..0.885 rows=7500 loops=1)
   Heap Fetches: 0
   Buffers: shared hit=1 read=32
 Execution Time: 1.051 ms

== plan: SELECT * , same rows ==
 Bitmap Heap Scan on t (actual time=1.233..27.039 rows=7500 loops=1)
   Heap Blocks: exact=4616
   Buffers: shared hit=802 read=3846 written=3744
   ->  Bitmap Index Scan on ix_cov (actual time=0.832..0.832 rows=7500 loops=1)
         Buffers: shared hit=32
 Execution Time: 27.296 ms

== bytes the server would send (COPY text format) ==
  indexed columns only: 75000
  SELECT *            : 21342095

== does EXPLAIN ANALYZE ever touch the TOAST table? ==
 toast blocks after EXPLAIN ANALYZE: 0
 toast blocks after really reading the column: 2000
Thirty-three buffers against 4,648, and 75 KB against 21 MB, for the same 7,500 rows. Then delete notes and meta from the target list of the second query and watch the plan flip back to Index Only Scan — that is the whole finding in one edit.