Reading a slow query plan without the folklore
Ignore the cost numbers. Put your finger on the estimated rows and the actual rows of every node, and find the first place they disagree by more than an order of magnitude. That node is your bug, and everything above it is a consequence.

Read rows= against actual rows= on every node, top to bottom, and find the first one where they disagree by more than about ten times. That node chose the plan; every slow thing above it is a consequence. The cost numbers are not milliseconds and comparing them across queries tells you nothing.
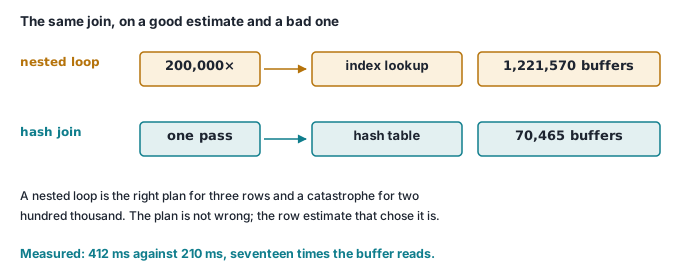
Below, in Postgres 16.15: a query where the planner estimated 1,970 rows and got 200,000, which produced a nested loop that touched 1,221,570 buffers instead of 70,465 and ran in 412 ms instead of 210 ms. One CREATE STATISTICS statement fixed it. No index was involved.
The problem
A query that used to be fine is now slow. The plan is forty lines. The advice you find says to look at the highest cost, or that a Seq Scan means a missing index. Both are folklore, and both send you off to add an index that will not help.
Start with what the numbers actually are.
EXPLAIN versus EXPLAIN ANALYZE
EXPLAIN shows what the planner believes. EXPLAIN ANALYZE runs the query and shows what happened as well. Only the second one is diagnostic, because the whole game is the difference between the two.
Two things about EXPLAIN ANALYZE that bite people.
It really runs the query. Including writes. This is not a dry run:
SELECT count(*) FROM orders WHERE status='refunded';   -- 200000
EXPLAIN (ANALYZE) DELETE FROM orders WHERE status='refunded';
SELECT count(*) FROM orders WHERE status='refunded';   -- 0
Two hundred thousand rows, gone, from a command most people think of as a read. Wrap anything that is not a SELECT:
BEGIN;
EXPLAIN (ANALYZE, BUFFERS) DELETE FROM orders WHERE status='paid';
ROLLBACK;
Verified: after the rollback the 1,800,000 rows were still there.
Per-node timing is not free. On a scan of 2,000,000 rows, the same query measured three ways:
| How | Execution time |
|---|---|
Plain query, \timing on |
~45 ms |
EXPLAIN (ANALYZE, TIMING OFF) |
47–53 ms |
EXPLAIN ANALYZE |
77–80 ms |
The clock reads alone added roughly 30 ms — about 65%. When you are comparing two plans, use TIMING OFF and compare BUFFERS instead; when you want a real wall-clock number, run the query without EXPLAIN at all.
And the cost figure, for completeness. That 2,000,000-row scan:
Finalize Aggregate  (cost=36229.33..36229.34 rows=1 width=16)
...
Execution Time: 48.963 ms
36,229 what? Arbitrary units, anchored to "one sequential page read = 1.0". It is a number the planner uses to rank its own options for one query. It is not milliseconds, and 36,229 in one query has no relationship to 36,229 in another.
The one signal: estimated rows versus actual rows
Here is the setup. Postgres 16.15, 2,000,000 orders and 100,000 customers. One order in ten is refunded — and every refunded order was taken over the phone and paid by invoice. The three columns are perfectly correlated.
CREATE TABLE orders (
  id bigserial PRIMARY KEY,
  customer_id bigint NOT NULL REFERENCES customers(id),
  status  text NOT NULL,
  channel text NOT NULL,
  payment text NOT NULL,
  reference text NOT NULL,
  total_cents int NOT NULL,
  placed_at timestamptz NOT NULL
);

INSERT INTO orders (customer_id, status, channel, payment, reference, total_cents, placed_at)
SELECT 1 + (g % 100000),
       CASE WHEN g % 10 = 0 THEN 'refunded' ELSE 'paid'    END,
       CASE WHEN g % 10 = 0 THEN 'phone'    ELSE 'web'     END,
       CASE WHEN g % 10 = 0 THEN 'invoice'  ELSE 'card'    END,
       'REF-' || lpad(g::text, 9, '0'),
       (g % 30000) + 100,
       timestamptz '2026-01-01' + (g % 240) * interval '1 day'
FROM generate_series(1, 2000000) g;

CREATE INDEX orders_status_idx  ON orders (status);
CREATE INDEX orders_channel_idx ON orders (channel);
CREATE INDEX orders_payment_idx ON orders (payment);
ANALYZE;
One column at a time, the planner is right:
EXPLAIN SELECT * FROM orders WHERE status = 'refunded';

Bitmap Heap Scan on orders  (cost=2218.68..25759.18 rows=199000 width=56)
199,000 estimated, 200,000 actual. Fine. Now all three at once:
EXPLAIN ANALYZE
SELECT * FROM orders WHERE status='refunded' AND channel='phone' AND payment='invoice';

Bitmap Heap Scan on orders  (cost=6508.76..12383.15 rows=1970 width=56)
                            (actual time=17.067..225.489 rows=200000 loops=1)
  ->  BitmapAnd  (cost=6508.76..6508.76 rows=1970 width=0) (actual rows=0 loops=1)
        ->  Bitmap Index Scan on orders_payment_idx (rows=199000) (actual rows=200000)
        ->  Bitmap Index Scan on orders_channel_idx (rows=199000) (actual rows=200000)
        ->  Bitmap Index Scan on orders_status_idx  (rows=199000) (actual rows=200000)
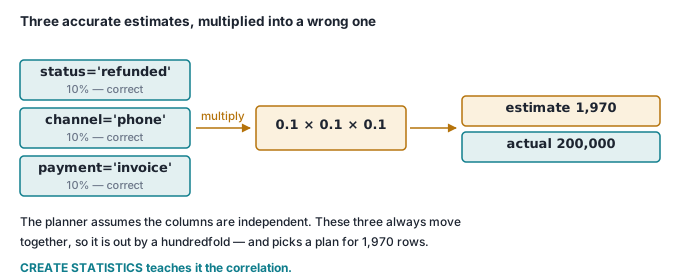
rows=1970 against actual rows=200000. A 101-fold underestimate, and you can see exactly where it came from: each child estimate is right, and the parent multiplied them. Postgres assumes columns are independent unless told otherwise, so 0.1 × 0.1 × 0.1 × 2,000,000 ≈ 2,000. In this data the second and third predicates remove nothing at all.
The statistic itself is harmless. What it does to the plan above it is not.
What a nested loop does with a bad estimate
Join those filtered orders to a 6,000,000-row order_lines table:
SELECT sum(l.line_cents)
FROM orders o JOIN order_lines l ON l.order_id = o.id
WHERE o.status='refunded' AND o.channel='phone' AND o.payment='invoice';
Believing there are about 2,000 orders, the planner picks a nested loop — for 2,000 rows, 2,000 index lookups is cheaper than hashing six million:
->  Nested Loop (actual rows=300000 loops=2)
      Buffers: shared hit=1139152 read=82418
      ->  Parallel Bitmap Heap Scan on orders o  (cost=... rows=1159)
                                                 (actual rows=100000 loops=2)
      ->  Index Scan using order_lines_order_id_idx on order_lines l
            (cost=0.43..14.63 rows=3 width=12) (actual rows=3 loops=200000)
            Buffers: shared hit=1139152 read=60849
Execution Time: 370.296 ms
loops=200000. That is the signature. The planner budgeted for roughly a thousand trips through the inner side and made two hundred thousand.
Note how the times are reported: the inner scan says actual time=0.002..0.003, which is per loop. Multiply, do not read it as a total — 0.003 ms × 200,000 is 600 ms of index work, spread over two workers. A node that looks instant is often the whole query.
Teach the planner that the columns move together:
CREATE STATISTICS orders_corr (ndistinct, dependencies, mcv)
  ON status, channel, payment FROM orders;
ANALYZE orders;
The estimate becomes rows=196933 against 200,000 actual, and the plan changes by itself:
->  Parallel Hash Join (actual rows=200000 loops=3)
      Hash Cond: (l.order_id = o.id)
      Buffers: shared hit=98 read=70367
      ->  Parallel Seq Scan on order_lines l (actual rows=2000000 loops=3)
      ->  Parallel Hash (actual rows=66667 loops=3)
Measured, five runs each, no EXPLAIN overhead, everything warm:
| Buffers touched | Median time | |
|---|---|---|
| Nested loop (bad estimate) | 1,221,570 | 412 ms |
| Hash join (estimate fixed) | 70,465 | 210 ms |
Same answer both ways: 2731500000.
Two honest notes. The buffer gap is 17× but the time gap is only 2×, because this whole dataset fits in RAM on a laptop and a buffer hit is cheap. Put those pages on a disk the server has to go and fetch and the time gap opens out towards the buffer gap — which is why BUFFERS is the more portable measurement, and why a 2× result on a laptop is not a promise of 2× in production. The other note: the fix was a statistics object, not an index. Every index this query could want already existed.
When a Seq Scan is correct
A Seq Scan in a plan is not a diagnosis. To read 90% of a table through an index Postgres has to read the index as well as the table, then recheck each row it finds. Reading the table once, start to finish, skips all of that. Postgres knows this and will choose it.
The same query, 1,800,000 of 2,000,000 rows, planner's choice versus forced:
SELECT count(*), sum(total_cents) FROM orders WHERE status = 'paid';
-- planner's choice
->  Parallel Seq Scan on orders (actual rows=600000 loops=3)
      Filter: (status = 'paid'::text)
      Rows Removed by Filter: 66667
      Buffers: shared hit=16042 read=5011
Execution Time: 90.198 ms

-- SET enable_seqscan = off;
->  Parallel Bitmap Heap Scan on orders (actual rows=600000 loops=3)
      Recheck Cond: (status = 'paid'::text)
      Heap Blocks: exact=7127
      Buffers: shared hit=98 read=22473
Execution Time: 159.413 ms
Timed properly, without EXPLAIN ANALYZE overhead: 45 ms sequential, 77 ms through the index. The index made it 1.7× slower, and the index is not even at fault — there is no way to read most of a table that beats reading the table.
SET enable_seqscan = off is the right way to check this and the wrong thing to leave switched on. It does not disable anything — it adds a flat penalty to the cost of a sequential scan so the planner avoids one where it can. You can see the penalty, and see the Seq Scan chosen anyway when there is no alternative:
SET enable_seqscan = off;
EXPLAIN SELECT count(*) FROM orders WHERE total_cents > 0;

Aggregate  (cost=10000051052.50..10000051052.51 rows=1 width=8)
  ->  Seq Scan on orders  (cost=10000000000.00..10000046053.00 rows=1999800 width=0)
        Filter: (total_cents > 0)
That leading 10000000000 is the penalty, not a real cost. Use the setting in a session to answer "would the other plan have been better?", then RESET it.
How a missing index actually shows up
It looks nothing like a large Seq Scan on a big table. It looks like this:
EXPLAIN (ANALYZE, BUFFERS)
SELECT id, total_cents FROM orders WHERE reference = 'REF-001234567';

Gather (actual time=59.372..61.064 rows=1 loops=1)
  Buffers: shared hit=16160 read=4893
  ->  Parallel Seq Scan on orders (actual rows=0 loops=3)
        Filter: (reference = 'REF-001234567'::text)
        Rows Removed by Filter: 666666
Execution Time: 61.097 ms
The tell is the ratio: Rows Removed by Filter: 666666, per worker, across three workers — two million rows read and thrown away to return one. That is what a missing index is. A Seq Scan that returns most of what it reads is doing its job; a Seq Scan that discards all but one row of two million is not.
CREATE INDEX orders_reference_idx ON orders (reference);
ANALYZE orders;
Index Scan using orders_reference_idx on orders (actual time=0.050..0.052 rows=1 loops=1)
  Index Cond: (reference = 'REF-001234567'::text)
  Buffers: shared hit=1 read=3
Execution Time: 0.077 ms
61.097 ms to 0.077 ms; 21,053 buffers to 4. Also worth noticing: the predicate moved out of Filter: and into Index Cond:. If a condition is still listed under Filter: after you add an index, the index is not being used for it — usually a type mismatch, a function wrapped around the column, or a leading column of a composite index that the query does not constrain.
So, the reading order:
actual rowsversusrowson every node. First disagreement over ~10× wins.loops=on the inner side of any nested loop. Multiply it out.Rows Removed by Filteragainst the rows returned.Buffersfor comparing two plans; wall clock for reporting.- Cost: only to understand why the planner chose what it chose. Never as a measure of anything.
Check it yourself
One container, port 55506, under four seconds. It reproduces the estimate collapse and the fix.
#!/usr/bin/env bash
set -euo pipefail

docker run -d --name plan-demo -e POSTGRES_PASSWORD=demo -p 55506:5432 postgres:16 >/dev/null
until docker exec plan-demo pg_isready -U postgres >/dev/null 2>&1; do sleep 1; done

docker exec -i plan-demo psql -U postgres -q -v ON_ERROR_STOP=1 <<'SQL'
CREATE TABLE orders (
  id bigserial PRIMARY KEY,
  status  text NOT NULL,
  channel text NOT NULL,
  payment text NOT NULL
);
-- one order in ten is refunded, and every refund is phone + invoice
INSERT INTO orders (status, channel, payment)
SELECT CASE WHEN g % 10 = 0 THEN 'refunded' ELSE 'paid'   END,
       CASE WHEN g % 10 = 0 THEN 'phone'    ELSE 'web'    END,
       CASE WHEN g % 10 = 0 THEN 'invoice'  ELSE 'card'   END
FROM generate_series(1, 500000) g;
CREATE INDEX ON orders (status);
CREATE INDEX ON orders (channel);
CREATE INDEX ON orders (payment);
ANALYZE;
SQL

echo '--- one column: the estimate is right ---'
docker exec plan-demo psql -U postgres -qtA -c \
"EXPLAIN (ANALYZE, TIMING OFF, SUMMARY OFF)
 SELECT * FROM orders WHERE status='refunded';" | head -1

echo
echo '--- three correlated columns: the estimate collapses ---'
docker exec plan-demo psql -U postgres -qtA -c \
"EXPLAIN (ANALYZE, TIMING OFF, SUMMARY OFF)
 SELECT * FROM orders WHERE status='refunded' AND channel='phone' AND payment='invoice';" | head -1

echo
echo '--- teach the planner that the columns move together ---'
docker exec plan-demo psql -U postgres -qtA -c \
"CREATE STATISTICS orders_corr (ndistinct, dependencies, mcv)
   ON status, channel, payment FROM orders;"
docker exec plan-demo psql -U postgres -qtA -c "ANALYZE orders;"
docker exec plan-demo psql -U postgres -qtA -c \
"EXPLAIN (ANALYZE, TIMING OFF, SUMMARY OFF)
 SELECT * FROM orders WHERE status='refunded' AND channel='phone' AND payment='invoice';" | head -1
--- one column: the estimate is right ---
Bitmap Heap Scan on orders  (cost=556.44..4422.81 rows=49550 width=22) (actual rows=50000 loops=1)

--- three correlated columns: the estimate collapses ---
Bitmap Heap Scan on orders  (cost=1633.01..2948.24 rows=487 width=22) (actual rows=50000 loops=1)

--- teach the planner that the columns move together ---
Bitmap Heap Scan on orders  (cost=1679.50..3018.03 rows=49967 width=22) (actual rows=50000 loops=1)
49,550 → right. 487 → wrong by about 100×. 49,967 → right again, without touching an index or the query. Your figures will differ in the last couple of digits; ANALYZE samples the table rather than reading all of it, so the estimates wobble between runs. The order of magnitude does not.
docker rm -f plan-demo
Where this goes next
This is how we look at the queries behind the Workflow Builder and the Postgres job queue underneath it — where a plan flip in the claim query shows up immediately as workers idling, and where SKIP LOCKED only behaves if the planner has the row counts roughly right. That queue is its own article.
Related: backups you have actually restored — the same argument applied to pg_dump, and the same fix, which is to run the thing and compare it against reality rather than trusting a number that looks plausible. Earlier in this series: where your database actually lives and one Caddyfile for TLS and routing.