Health checks that tell you something
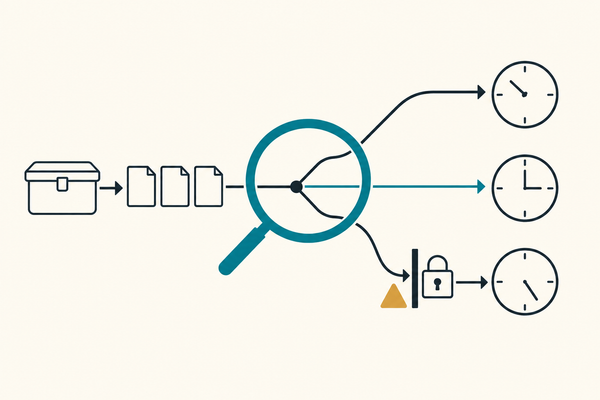
A /health that always returns 200 tells you the HTTP listener works — which was never the thing that broke. Split liveness from readiness, put a timeout on every dependency check, and never let a downstream failure trigger a restart that cannot fix it.
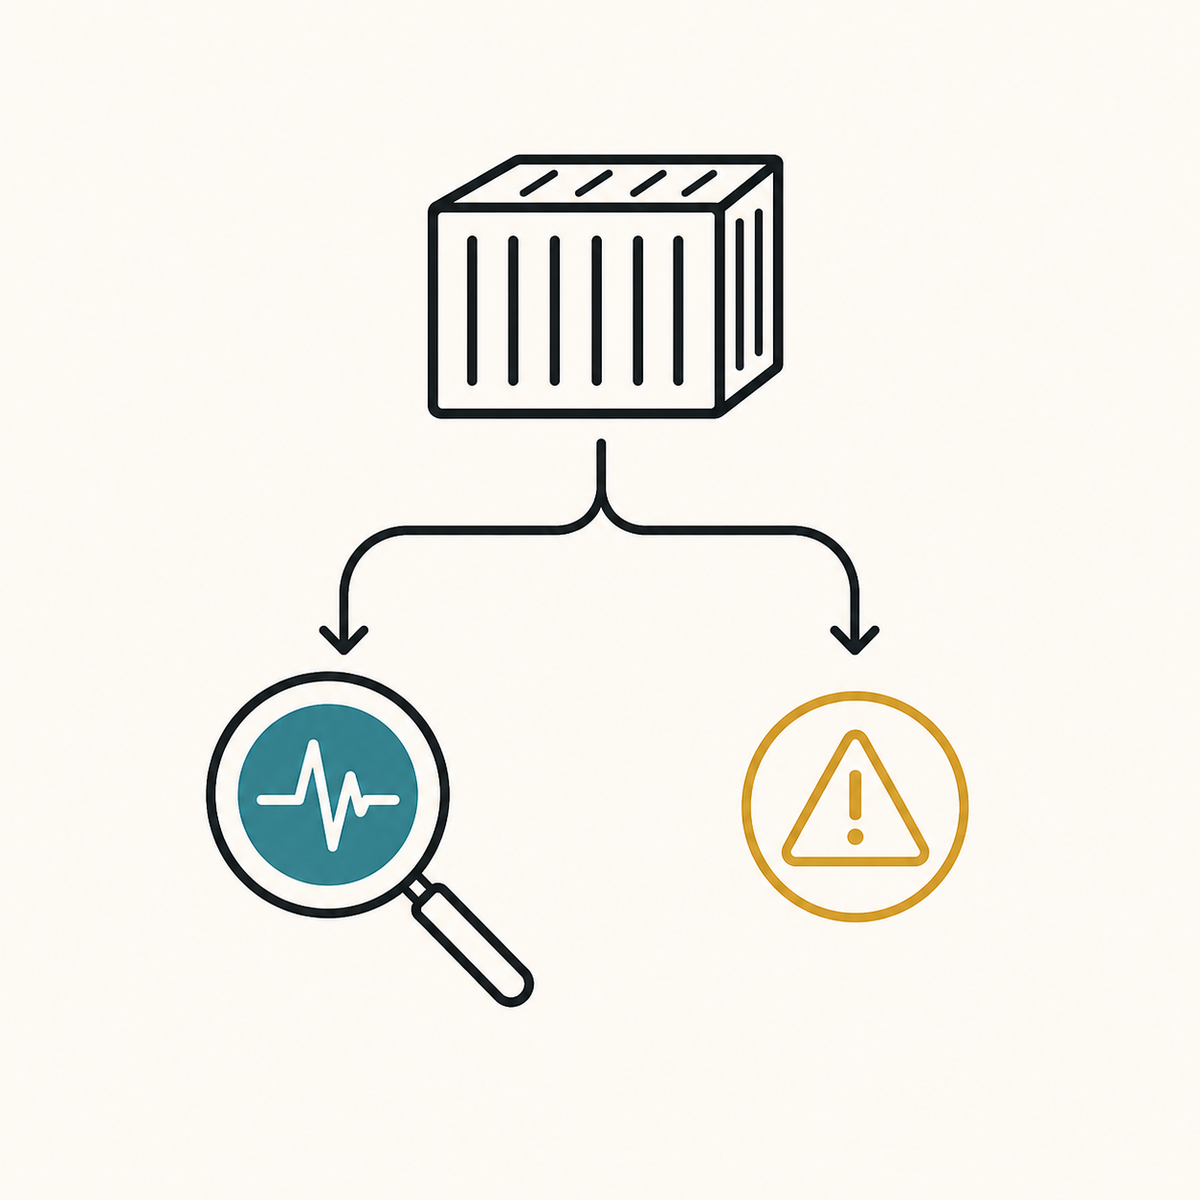
Ship two endpoints, not one. /healthz answers "is this process still running" and touches nothing outside itself. /readyz answers "can this process serve a request right now" and checks its dependencies — each one behind a timeout. Wire container restarts to the first and load-balancer traffic to the second, and never the other way around.
The distinction is not pedantry. Getting it backwards turns a thirty-second database blip into a restart loop that outlives the blip.
A health check that only returns 200
Here is the endpoint almost everyone ships first:
app.get('/health', (req, res) => res.send('OK'));
It proves the process is bound to a port and the HTTP parser works. Both of those were fine. Watch it stay green while the app cannot serve anything.
A Node 23 service, a pg pool with max: 2, and two slow queries holding both connections. Then:
--- /healthz:
{"status":"alive"} [200]
--- /readyz:
{"status":"not_ready","db_ms":801,"error":"timeout exceeded when trying to connect"} [503]
Every real request is queued behind an exhausted pool. The bare check reports 200 and your dashboard is green. This is the failure mode: a health check that cannot fail is not a check, it is a decoration.
Liveness and readiness are different questions
Liveness (/healthz) |
Readiness (/readyz) |
|
|---|---|---|
| Asks | is this process running? | can it serve right now? |
| Checks | nothing external | database, cache, disk, queue |
| Failure means | restart me | stop sending me traffic |
| Consumer | Docker, Kubernetes kubelet | load balancer, proxy, depends_on |
| Safe to fail often | no | yes |
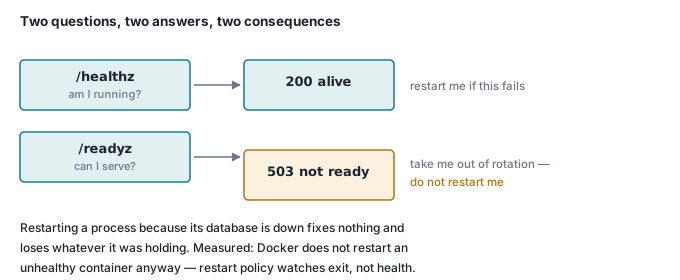
The last row is the one that matters. Readiness failing is normal and self-correcting: traffic goes elsewhere, the dependency recovers, traffic comes back. Liveness failing is destructive — something kills the process. Put a dependency on the liveness path and you have handed a downstream service the power to kill you.
Why the obvious approach fails
The obvious approach is one endpoint that checks everything, wired to the container's HEALTHCHECK. Here are two identical apps, differing only in which endpoint their health check probes, with restart: unless-stopped on both. The database is stopped at t+0.
t+ 5s  right=healthy   restarts=0   wrong=healthy   restarts=0
t+10s  right=healthy   restarts=0   wrong=healthy   restarts=0
t+15s  right=healthy   restarts=0   wrong=unhealthy restarts=0
t+20s  right=healthy   restarts=0   wrong=unhealthy restarts=0
t+36s  right=healthy   restarts=0   wrong=unhealthy restarts=0
readiness says why:
{"status":"not_ready","db_ms":13,"error":"getaddrinfo ENOTFOUND db"}
Fifteen seconds to unhealthy, which is exactly retries × interval — three checks, five seconds apart. Two things in that output are worth stopping on.
restarts=0. Docker Engine marks a container unhealthy and does nothing else. It does not restart it, and restart: unless-stopped does not change that — the restart policy reacts to the process exiting, not to the health status. If you have only ever run health checks under plain Docker or Compose, you may have a broken cascading check today and no symptom, because nothing is acting on it. Kubernetes' livenessProbe, Docker Swarm, and the various autoheal sidecars all do act on it. The bug is latent until you move.
What acting on it costs. Restarting wrong by hand, the way an orchestrator would:
  t+42s  wrong=starting
  t+52s  wrong=starting
  t+57s  wrong=starting
  t+62s  wrong=unhealthy
The restart bought twenty-five seconds of starting — start_period plus retries × interval — and then it was unhealthy again. That is the loop. Every cycle throws away warm connections and in-flight work to re-learn that a different container is down.
Now bring the database back and touch nothing else:
infra2-wrong	Up 42 seconds (healthy)
infra2-right	Up About a minute (healthy)
infra2-db	Up 12 seconds (healthy)
{"status":"ready","db_ms":10}
Both recovered on their own, within twelve seconds, with zero restarts required. The restart never helped. It could not have: the fault was never in the process being restarted.
The fix
import http from 'node:http';
import pg from 'pg';

const VERSION = process.env.APP_VERSION || '1.4.2';
const STARTED = Date.now();

// query_timeout is client-side: pg destroys the connection when it fires, so a
// stalled server cannot pin a pool slot forever.
const pool = new pg.Pool({
  connectionString: process.env.DATABASE_URL,
  max: 4,
  connectionTimeoutMillis: 800,
  query_timeout: 800,
});

// Without this listener, a Postgres restart makes pg emit 'error' on the pool
// with nothing listening, and Node kills the process.
pool.on('error', (e) => console.error('pool error:', e.message));

const send = (res, code, body) => {
  const s = JSON.stringify(body);
  res.writeHead(code, {
    'content-type': 'application/json',
    'content-length': Buffer.byteLength(s),
  });
  res.end(s);
};

http.createServer(async (req, res) => {
  const path = req.url.split('?')[0];

  // LIVENESS. No dependencies. Failing this means "restart me".
  if (path === '/healthz') {
    return send(res, 200, {
      status: 'alive',
      version: VERSION,
      uptime_s: Math.round((Date.now() - STARTED) / 1000),
    });
  }

  // READINESS. Dependencies, each behind a timeout. Failing this means
  // "stop sending me traffic" and nothing more.
  if (path === '/readyz') {
    const t0 = Date.now();
    let db;
    try {
      await pool.query('SELECT 1');
      db = { ok: true, ms: Date.now() - t0 };
    } catch (e) {
      db = { ok: false, ms: Date.now() - t0, error: e.message };
    }
    return send(res, db.ok ? 200 : 503, {
      status: db.ok ? 'ready' : 'not_ready',
      version: VERSION,
      checks: { database: db },
    });
  }

  send(res, 404, { error: 'not found' });
}).listen(process.env.PORT || 8080);
Three details in there were each learned the hard way. (The transcripts below ran this on the host with PORT=55532; in a container it is 8080.)
The pool.on('error') line is not optional. The first version of this had no listener. Stopping Postgres under it produced:
node:events:491
      throw er; // Unhandled 'error' event
      ^
error: terminating connection due to administrator command
  ...
  code: '57P01',
The process died. A readiness check exists to report on a dependency, and without that one line it takes the app down with it — converting a readiness failure into a genuine liveness failure. Adding the handler, the same test becomes a clean 503 and then a clean recovery with no restart.
Every dependency check needs a timeout, and it has to be the client's. /readyz-naive below is the identical handler against a second pool built without connectionTimeoutMillis or query_timeout. With the database container paused rather than stopped — a stalled server, not a refused connection, which is what a saturated disk or an exhausted connection limit looks like:
$ time curl -s -m 30 -w " [%{http_code}]\n" http://127.0.0.1:55532/readyz-naive
 [000]
curl ... 30.015 total
exit: 28
Thirty seconds, no answer, curl gave up. With connectionTimeoutMillis and query_timeout set to 800 ms, the identical situation:
{"status":"not_ready","version":"1.4.2","checks":{"database":{"ok":false,"ms":804,
 "error":"Connection terminated due to connection timeout"}}} [503]
804 ms. Your check's timeout must be shorter than the timeout of whatever is calling it. A HEALTHCHECK --timeout=2s probing an endpoint that can block for thirty seconds does not report "slow", it reports "unhealthy" — you have built the cascade you were trying to avoid.
query_timeout also does a second job. Repeating the pool-exhaustion test from the top of this article with query_timeout: 800 set, the runaway queries are killed at 800 ms, both pool slots come back, and readiness never goes red at all.
Return a body, not an empty 200. {"version": "1.4.2"} in the readiness response is how you find out that the container answering your load balancer is the one from the deploy before last.
Docker HEALTHCHECK, precisely
FROM node:23-alpine
WORKDIR /app
COPY package.json ./
RUN npm install --omit=dev
COPY app.js ./
CMD ["node", "app.js"]
HEALTHCHECK --interval=5s --timeout=2s --start-period=10s --retries=3 \
  CMD wget -q -O /dev/null http://127.0.0.1:8080/healthz || exit 1
wget, not curl. node:23-alpine ships busybox wget and no curl at all:
$ docker run --rm node:23-alpine sh -c 'command -v wget; command -v curl || echo "no curl"'
/usr/bin/wget
no curl
Installing curl to run a health check adds a package to every image you ship for one HTTP GET. Use what is there.
The timing is arithmetic, not magic:
- Time to
unhealthyfrom running:retries × interval— measured 15 s at--retries=3 --interval=5s. - Time to
unhealthyfrom start:start_period + retries × interval— measured 25 s with--start-period=10s.
start_period is the grace window for a slow boot; failures inside it leave the status at starting rather than flipping it to unhealthy.
One gotcha for whatever scrapes this. A container with no HEALTHCHECK has no Health key at all, and the inspect fails rather than returning "unknown":
$ docker inspect infra2-db --format '{{.State.Health.Status}}'
template parsing error: ... map has no entry for key "Health"
exit: 1
depends_on: condition: service_healthy
This is the one place readiness belongs in a compose file — as a startup gate:
services:
  db:
    image: postgres:16
    healthcheck:
      test: ["CMD-SHELL", "pg_isready -U postgres -d postgres"]
      interval: 3s
      timeout: 3s
      retries: 10
      start_period: 5s
  app:
    build: .
    depends_on:
      db:
        condition: service_healthy
 Container infra2-db Started
 Container infra2-db Waiting
 Container infra2-db Healthy
 Container infra2-right Started
real	0m8.541s
Waiting, then Healthy, then the app starts. Without the condition, depends_on only waits for the container to be created, which for Postgres is several seconds before it accepts a connection.
But note what it does not do. When the database was stopped mid-run in the test above, Compose did nothing — no restart, no re-gating. service_healthy is a one-time ordering constraint at up time. It is not a substitute for the app handling a dependency that disappears later, which is what the readiness endpoint and the pool error handler are for.
Check it yourself
Two identical apps, one health check each, one deliberate mistake. Take the app.js and the Dockerfile from above, add this compose file, and run the four commands under it. Ports 55533 and 55535, so it collides with nothing.
services:
  db:
    image: postgres:16
    container_name: hc-db
    environment: { POSTGRES_PASSWORD: demo }
    healthcheck:
      test: ["CMD-SHELL", "pg_isready -U postgres -d postgres"]
      interval: 3s
      timeout: 3s
      retries: 10
      start_period: 5s
  right:
    build: .
    container_name: hc-right
    restart: unless-stopped
    environment: { DATABASE_URL: "postgres://postgres:demo@db:5432/postgres" }
    ports: ["55533:8080"]
    healthcheck:                       # liveness: this process only
      test: ["CMD-SHELL", "wget -q -O /dev/null http://127.0.0.1:8080/healthz || exit 1"]
      interval: 5s
      timeout: 2s
      start_period: 10s
      retries: 3
    depends_on: { db: { condition: service_healthy } }
  wrong:
    build: .
    container_name: hc-wrong
    restart: unless-stopped
    environment: { DATABASE_URL: "postgres://postgres:demo@db:5432/postgres" }
    ports: ["55535:8080"]
    healthcheck:                       # the mistake: liveness wired to a dependency
      test: ["CMD-SHELL", "wget -q -O /dev/null http://127.0.0.1:8080/readyz || exit 1"]
      interval: 5s
      timeout: 2s
      start_period: 10s
      retries: 3
    depends_on: { db: { condition: service_healthy } }
docker compose up -d --build && sleep 16
docker compose stop db

# watch them disagree
for _ in $(seq 1 7); do sleep 5
  docker inspect hc-right --format 'right {{.State.Health.Status}} restarts={{.RestartCount}}'
  docker inspect hc-wrong --format 'wrong {{.State.Health.Status}} restarts={{.RestartCount}}'
done

docker restart hc-wrong      # what an orchestrator does. It buys 25s.
docker compose start db      # both recover, nothing needed restarting
docker compose down -t 2
(The transcripts earlier in the article are from the same run under a different container-name prefix — right and wrong are the services either way.)
The run above is where every number in this article came from. If yours differs, the arithmetic in "Docker HEALTHCHECK, precisely" is the first thing to check — interval and retries are the only knobs that move those figures.
Where this goes next
These are the probes in front of the containers behind Simple CRM and the Workflow Builder, sitting behind one Caddyfile for TLS and routing — Caddy needs a readiness endpoint to decide what to route to, and it needs that endpoint to answer in under a second.
The same two endpoints do a second job in software a customer runs themselves: they are the first thing you ask for when a support ticket arrives. That, the preflight checks and the support bundle are in self-hosting without the support hell, which follows on from shipping your software as a Docker image.