How many jobs a second can a Postgres queue really handle?
We benchmarked a SKIP LOCKED job queue on Postgres 16 at 1 to 100 concurrent workers. It peaks near 16,000 claims a second — and the first thing to break is autovacuum, not row locks.

A single Postgres 16 table served about 16,000 job claims a second at peak on a laptop, and roughly 10,000 a second sustained — but only 5,300 a second by the end of one minute of unbroken load, because nothing had vacuumed it. The received wisdom is that a Postgres queue falls over on lock contention. It does not. Across every run, waiting on another worker's row lock accounted for 0.1% of the time at eight workers. The write-ahead log and the vacuum cadence accounted for nearly all of it.
This is the sequel to a job queue in Postgres, when the worker can't be reached, which built the SELECT ... FOR UPDATE SKIP LOCKED claim pattern and asserted the queue "tops out somewhere in the low thousands of jobs per second". That was a guess. This is the measurement, and the guess was low.
The short answer
- A SKIP LOCKED Postgres queue peaked at 16,038 claims per second at 16 concurrent workers on an 8-core Apple M3 laptop running Postgres 16.15 in Docker. Past 16 workers throughput falls: 100 workers managed 6,573/sec.
- Row lock contention is not the bottleneck. At 8 workers,
Lock:transactionidwas 0.1% of sampled wait time. WAL writing and syncing were 58%. That is the whole point ofSKIP LOCKED— workers never queue behind each other. - Under sustained load with stock settings, throughput decays 3x in 60 seconds — 16,141/sec in the first ten seconds down to 5,770/sec by second 40 — because dead index entries pile up faster than autovacuum removes them.
- Telling autovacuum the table is a queue makes that decay disappear. With
autovacuum_vacuum_scale_factor = 0.02andautovacuum_naptime = 5s, the same minute held flat at 15,400-16,700/sec throughout. - The partial index on
status = 'queued'is worth roughly 470x. On a table with 1.8 million completed jobs, the partial index gave 13,499 claims/sec; a plain index oncreated_atgave 28.5/sec.
What was measured, and on what
Apple M3, 8 cores, 16 GB RAM, macOS 26.4.1. Postgres 16.15 (aarch64) in Docker 29.5.2, with 8 CPUs and 8.3 GB visible to the Docker VM, shared_buffers=512MB, max_connections=200, --shm-size=1g.
These are indicative figures from a laptop running Docker, not a tuned server benchmark. Docker Desktop on macOS puts a virtualised filesystem under the WAL, and the database competes for cores with everything else. A real server with dedicated NVMe will be faster. What transfers is not the absolute number; it is the shape — where the curve bends, and which thing bends it.
The load generator is pgbench inside the container over the Unix socket, so client round-trip cost is excluded. The table is the one from the previous article, with a distinct created_at per row so ORDER BY created_at is a real ordering and not a tie. Every configuration was run at least twice; both numbers are given, not the better one.
Does it scale past four workers?
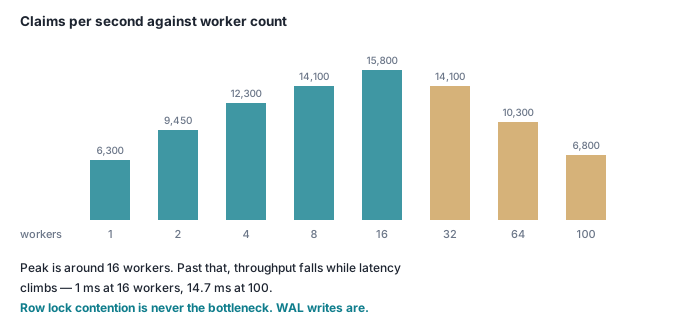
Yes, but barely. 1.2 million queued rows, freshly vacuumed, 15 seconds per run.
| Workers | Run 1 (claims/sec) | Run 2 (claims/sec) | Mean latency | Per worker |
|---|---|---|---|---|
| 1 | 6,387 | 6,133 | 0.16 ms | ~6,260 |
| 2 | 9,356 | 9,545 | 0.21 ms | ~4,725 |
| 4 | 11,694 | 12,895 | 0.34 ms | ~3,070 |
| 8 | 15,357 | 12,820 | 0.62 ms | ~1,760 |
| 16 | 16,038 | 15,553 | 1.00 ms | ~990 |
| 32 | 14,007 | 14,209 | 2.27 ms | ~440 |
| 64 | 10,435 | 10,242 | 6.19 ms | ~160 |
| 100 | 7,069 | 6,573 | 14.7 ms | ~68 |
One worker to two buys 1.5x. Two to four buys 1.3x. Four to eight buys 1.15x. Eight to sixteen buys 1.12x, and after that more workers means less throughput and more latency. Ninety-six extra workers turned 6,387 claims a second into 6,573.
That is the signature of a saturated shared resource: latency rises in proportion to worker count while throughput stays flat, which means the extra workers are queueing, not working.
Those figures are from inside the container. Driving the identical query from a Node client on the host, through Docker's port forwarding, eight workers reached only 6,595-6,764 claims a second — a single SELECT 1 costs 0.011 ms over the Unix socket and 0.112 ms from the host. If your workers are not on the database host, the network round trip sets your ceiling, not Postgres.
What breaks first?
Not what everyone says. Sampling pg_stat_activity during an 8-worker run holding 12,390 claims/sec:
| Wait event | Share of samples |
|---|---|
LWLock:WALWrite |
44.9% |
| CPU (running) | 38.6% |
IO:WALSync |
12.8% |
Client:ClientRead |
2.8% |
LWLock:BufferContent |
0.6% |
Lock:transactionid (waiting on another worker's row lock) |
0.1% |
Fifty-eight percent of the time is the write-ahead log; one tenth of one percent is row lock contention. SKIP LOCKED does its job so completely that the thing it prevents effectively does not happen.
Remove the durability and the WAL's share shows: with synchronous_commit = off, the same 8-worker test went from 12,851-14,534 claims/sec to 19,591-19,599. That 1.4x costs you the last fraction of a second of commits on a crash, so a few jobs could be claimed twice — survivable if you are idempotent, but a trade to make deliberately.
The profile only changes once you badly oversubscribe. At 64 workers, LWLock:BufferContent becomes the top wait at 30.8%, with LWLock:LockManager at 18.9% and Lock:transactionid finally climbing to 8.9%. Every worker is fighting over the same leftmost leaf page of the index — they all want the oldest job. Even there, row locks are fourth on the list.
Does the partial index actually matter?
Two million rows, the oldest 1.8 million marked done, table vacuumed, 200,000 still queued — a queue that has been running a while. Four workers, ten seconds:
| Index on the jobs table | Claims/sec (2 runs) | Time for one claim scan |
|---|---|---|
(created_at) WHERE status = 'queued' |
13,360 / 13,499 | 0.051 ms |
(created_at), no predicate |
28.6 / 28.5 | 120.4 ms |
| none (primary key only) | 25.3 / 37.0 | 99.7 ms |
A plain index on created_at is no better than no index at all. EXPLAIN ANALYZE says why in one line: Rows Removed by Filter: 1800000. The scan walks the index in created_at order and every completed job is still in it, sitting in front of the queued ones. With no index at all the planner falls back to a sequential scan plus an external merge sort spilling 6 MB per claim. EXPLAIN ANALYZE on slow queries covers reading those plans.
The partial index does have a cost, and it is not the one you would guess. Because status appears in the index predicate, changing it is HOT-blocking. Measured over the same workload: with the partial index, 0 of 108,438 updates were HOT. With a plain index on created_at — where status is not part of any index — 17,923 of 22,440 were HOT, 79.9%. Every claim against the partial index therefore writes a new index entry and kills an old one. Which brings us to the part that actually hurts.
What happens when you stop vacuuming?
This is where a Postgres queue really fails, and it fails quietly.
Take that 2-million-row table, disable autovacuum on it, complete 1.8 million jobs, and do not vacuum. Dead tuples: 1,797,296. The table grows from 161 MB to 306 MB without gaining a single row. The first claim scan afterwards touches 28,388 buffers and takes 114.3 ms. Sustained throughput at four workers collapses to 1,393 and 1,324 claims/sec — a tenfold drop from the 13,400 the same table managed when clean.
VACUUM jobs took 0.62 seconds and removed all 1,800,000 dead tuples, deleting 4,935 of the index's 5,487 pages. After it, the claim scan touched 6 buffers and took 0.120 ms, and throughput returned to 11,014-13,324/sec.
Two things VACUUM does not do. The table stayed at 306 MB and the index at 43 MB — the space is reusable but not returned. REINDEX INDEX jobs_queue_idx took the index from 43 MB to 4,408 kB. VACUUM FULL took the table back to 161 MB. Both need locks you do not want to take casually on a live queue.
Now the part that surprised us. We expected the decay to be a slow, background problem. It is not — it happens inside a single minute. Sixty seconds of unbroken load at eight workers, stock configuration:
| Elapsed | Run 1 (claims/sec) | Run 2 (claims/sec) |
|---|---|---|
| 0-10 s | 16,141 | 15,825 |
| 10-20 s | 10,488 | 10,189 |
| 20-30 s | 8,238 | 7,426 |
| 30-40 s | 6,902 | 5,770 |
| 40-50 s | 8,503 | 9,854 |
| 50-60 s | — | 10,479 |
| whole minute | 10,730 | 9,924 |
Throughput falls by a factor of nearly three, then partially recovers — that recovery is autovacuum finally arriving. It fired exactly once per run. Stock settings trigger a vacuum at 20% of the table's rows plus 50, which on 1.5 million rows means 300,050 dead tuples, and the launcher only wakes every 60 seconds. At 10,000 claims a second you generate that backlog in half a minute. Autovacuum is a background janitor on a one-minute clock, and a queue table can outrun it in thirty seconds.
Tell it otherwise and the problem vanishes:
ALTER TABLE jobs SET (
  autovacuum_vacuum_scale_factor = 0.02,   -- 2% of rows, not 20%
  autovacuum_vacuum_threshold    = 1000,
  autovacuum_vacuum_cost_delay   = 0       -- do not throttle it
);
-- and, server-wide:
ALTER SYSTEM SET autovacuum_naptime = '5s';
The same minute, same load, with those settings: 16,745, 16,135, 15,787, 15,966, 15,445, 16,008 claims/sec. Flat. Autovacuum ran 11 times instead of once, and the average for the minute went from 9,924 to 16,014 — a 1.6x improvement from four lines of configuration and no code change at all.
If you would rather see it than trust it, run a manual VACUUM jobs in the middle of an unbroken run: we measured 8,143 claims/sec immediately before and 14,676 immediately after.
So what number should I plan for?
Reading these figures conservatively, and remembering that a real job does real work while these workers only claimed rows:
- Below 1,000 jobs/sec, the queue is not your problem. Nothing we measured came close to struggling there. Do not add a broker for this.
- Between 1,000 and 10,000 jobs/sec, it works — if you have done two things: the partial index on
status = 'queued', and autovacuum settings that suit a high-churn table. Miss either and you will be at a tenth of that, wondering why. - Above roughly 15,000 claims/sec on hardware like this, extra workers make it slower, and you are contending on index leaf pages and the WAL. Four to sixteen workers is the useful operating range; a connection pooler in front is worth more than more workers.
- Above that, the shape of the problem has changed and a purpose-built broker earns its complexity. Cron, queue or event stream covers choosing between them.
A Postgres queue is fast enough that almost nobody reading this will reach its ceiling. The reason people believe otherwise is that they hit the autovacuum ceiling at a tenth of the real number and blamed the design.
Check it yourself
One container, three and a half minutes. It seeds 1.2 million jobs, sweeps the worker count, then runs the same minute of load twice — once with stock autovacuum, once with autovacuum told what kind of table this is.
docker run --rm -d --name cite-queue-demo --shm-size=1g \
  -e POSTGRES_PASSWORD=demo -p 55562:5432 postgres:16 -c shared_buffers=512MB
until docker exec cite-queue-demo pg_isready -U postgres >/dev/null 2>&1; do sleep 1; done

docker exec cite-queue-demo psql -U postgres -q -c "
CREATE TABLE jobs (
  id BIGSERIAL PRIMARY KEY,
  status TEXT NOT NULL DEFAULT 'queued',
  payload JSONB NOT NULL,
  worker_id TEXT,
  created_at TIMESTAMPTZ NOT NULL DEFAULT now(),
  claimed_at TIMESTAMPTZ);"

docker exec cite-queue-demo bash -c "cat > /tmp/claim.sql <<'SQL'
UPDATE jobs SET status='claimed', worker_id=:client_id::text, claimed_at=now()
 WHERE id = (SELECT id FROM jobs WHERE status='queued'
             ORDER BY created_at FOR UPDATE SKIP LOCKED LIMIT 1);
SQL"
Seed it, with a distinct created_at per row so the ordering is real:
seed() {
  docker exec cite-queue-demo psql -U postgres -q -c "TRUNCATE jobs;" -c "
    INSERT INTO jobs (payload, created_at)
      SELECT jsonb_build_object('n', g), now() + (g * interval '1 millisecond')
        FROM generate_series(1, 1200000) g;"
  docker exec cite-queue-demo psql -U postgres -q \
    -c "CREATE INDEX IF NOT EXISTS jobs_queue_idx ON jobs (created_at) WHERE status='queued';" \
    -c "VACUUM (ANALYZE) jobs;"
}
Sweep the worker count. Ours: 6,877 at 1 worker, 13,260 at 4, 15,852 at 8, 17,800 at 16, then back down to 13,184 at 32.
for c in 1 4 8 16 32; do
  seed; printf "%3s workers: " $c
  docker exec cite-queue-demo pgbench -U postgres -n -f /tmp/claim.sql \
    -c $c -j $c -T 10 postgres 2>&1 | grep '^tps'
done
A minute of load with stock autovacuum. Ours decayed 13,881 → 8,173 → 7,418, then recovered to 12,540 when autovacuum finally ran. Average: 10,503/sec.
seed
docker exec cite-queue-demo pgbench -U postgres -n -f /tmp/claim.sql \
  -c 8 -j 8 -T 60 -P 15 postgres 2>&1 | grep -E '^progress|^tps'
The same minute, with autovacuum tuned for churn. Ours: 17,684, 16,991, 17,378, 17,455. Flat, and 1.65x the average.
seed
docker exec cite-queue-demo psql -U postgres -q -c "
  ALTER TABLE jobs SET (autovacuum_vacuum_scale_factor=0.02,
                        autovacuum_vacuum_threshold=1000,
                        autovacuum_vacuum_cost_delay=0);"
docker exec cite-queue-demo psql -U postgres -q -c "ALTER SYSTEM SET autovacuum_naptime='5s';"
docker exec cite-queue-demo psql -U postgres -q -c "SELECT pg_reload_conf();"
docker exec cite-queue-demo pgbench -U postgres -n -f /tmp/claim.sql \
  -c 8 -j 8 -T 60 -P 15 postgres 2>&1 | grep -E '^progress|^tps'

docker rm -f cite-queue-demo
If your numbers differ from ours, the interesting part is not the absolute values — it is whether the last two blocks still differ from each other by about the same factor. That factor is the finding.
Where this goes next
This queue runs under Workflow Builder, where every step of a user-defined flow is a claimed job — with the autovacuum settings above in the schema, because of these measurements.