How many Postgres connections is too many?
We swept a read-mostly workload from 5 to 400 concurrent connections against a fixed CPU allocation on Postgres 16. Throughput peaks at about four times the core count. Past that, throughput degrades gently and latency degrades catastrophically — and the number that actually justifies a pooler is 2.
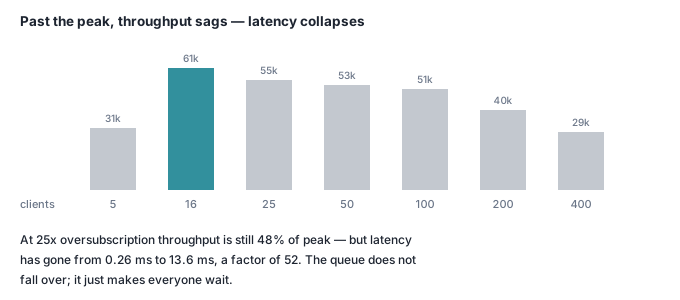
On four cores, Postgres 16 peaked at 16 concurrent connections — four times the core count — and 400 connections delivered 48% of that peak throughput at 52 times the latency. The folklore fix for FATAL: sorry, too many clients already is to raise max_connections and move on. It does make the error go away. It also converts a throughput problem into a latency problem, and the measurements below say that is a bad trade.
Two results surprised us. Throughput did not collapse past the peak — it sagged gently, which is exactly why the folklore survives. And pgbouncer made an already-pooled workload measurably slower.
The short answer
- Postgres 16 throughput peaked at four connections per core. On a 4-core allocation the peak was 61,304 transactions/sec at 16 connections; on a 2-core allocation it was 34,939/sec at 8 connections. Same multiple, both times.
- Past the peak, throughput falls slowly and latency rises fast. Going from 16 to 400 connections cost 52% of throughput but multiplied mean latency by 52x, from 0.261 ms to 13.626 ms. Latency is the thing oversubscription destroys.
- An idle Postgres connection costs about 1.9 MiB of real memory — measured as the container's cgroup usage rising from 1.169 GiB at 10 connections to 1.528 GiB at 200. Summing per-process RSS says 6.9 GB, which is nonsense: the container is capped at 4 GB.
- A query on a connection you already hold takes 0.052 ms; the same query on a freshly opened connection takes 3.09 ms. That is 59x, and it is the entire argument for a connection pool.
- SCRAM authentication is 73% of that connection cost — 2.09 ms of the 2.86 ms handshake. It is also why putting pgbouncer in front of a connect-per-request app only recovered 1.3x, instead of the 6.5x it recovered when authentication was free.
What was measured, and on what
Apple M3, 8 cores, 16 GB RAM, macOS 26.4.1. Docker Desktop 4.75.0, engine 29.5.2, with 8 CPUs and 7.75 GiB visible to the Linux VM. Postgres 16.15 (aarch64, Debian build) in a container limited to --cpus=4 (and --cpus=2 for the core-count comparison), --memory=4g, --shm-size=1g, with max_connections=600, shared_buffers=1GB and work_mem=4MB.
The workload is pgbench at scale 50 — a 755 MB database, prewarmed so it sits entirely in shared buffers — driven as -b select-only@9 -b simple-update@1: 90% single-row primary-key SELECTs, 10% single-row UPDATEs. No disk reads, so what we are measuring is CPU, locks and the WAL, not storage.
pgbench runs in a separate container with its own 4-CPU quota, so client and server never share a CPU budget. During runs Postgres sat at 391-417% CPU — its entire quota — while pgbench sat at 144-152%. The server is the bottleneck, which is the only condition under which this experiment means anything.
These are indicative figures from a laptop running Docker, not a tuned server benchmark, and noisier than we would like: macOS background work shifted absolute throughput by up to 40% between measurement windows. Every sweep below therefore runs three passes, ordering client counts ascending, descending, then ascending, so drift cannot masquerade as a trend; we report the median and the full range. Port the shape, not the absolute numbers.
Where does Postgres throughput actually peak?
Four CPUs, three passes of 15 seconds at each client count.
| Concurrent connections | tps (median) | tps (range) | Mean latency | % of peak |
|---|---|---|---|---|
| 5 | 31,213 | 29,377–39,886 | 0.160 ms | 51% |
| 10 | 50,187 | 46,361–55,097 | 0.199 ms | 82% |
| 16 | 61,304 | 55,978–61,362 | 0.261 ms | 100% |
| 25 | 54,566 | 50,843–59,396 | 0.458 ms | 89% |
| 50 | 52,541 | 49,204–58,669 | 0.952 ms | 86% |
| 100 | 50,770 | 40,160–51,101 | 1.970 ms | 83% |
| 200 | 39,893 | 34,801–39,993 | 5.013 ms | 65% |
| 400 | 29,355 | 25,256–29,535 | 13.626 ms | 48% |
The peak is at 16 connections on 4 cores. Now look at the decline. At 100 connections — six times oversubscribed — you still have 83% of peak throughput. That is the trap: if you only watch transactions per second, oversubscription looks nearly free, and the folklore that max_connections is a harmless dial looks correct.
The latency column tells the real story. Between 16 and 400 connections throughput dropped by half while mean latency went up 52-fold. Twenty-five times as many connections bought nothing and cost every user thirteen milliseconds.
Is four-per-core a coincidence of this box? We reran 2-core and 4-core allocations interleaved inside a single time window, so host drift hits both equally. Medians of three 12-second runs:
| Concurrent connections | 2 cores (tps) | 4 cores (tps) |
|---|---|---|
| 2 | 29,621 | 28,921 |
| 4 | 33,054 | 33,256 |
| 8 | 34,939 | 48,349 |
| 16 | 32,724 | 61,475 |
Two cores peak at 8 connections. Four cores peak at 16, and the 61,475 here matches the 61,304 from the separate sweep above to within 0.3% — the shape reproduces even when the absolute level does not. Both peaks are at 4x the core count.
Why does adding connections make it slower?
Because past saturation, the extra backends are not computing. They are queuing for a lock. Sampling pg_stat_activity for active client backends during two runs on 4 cores:
| Wait state | 25 connections (44,350 tps) | 400 connections (25,488 tps) |
|---|---|---|
LWLock:WALWrite |
62.7% | 74.1% |
LWLock:WALInsert |
— | 10.5% |
IPC:ProcArrayGroupUpdate |
0.3% | 7.0% |
Client:ClientRead |
16.9% | 4.1% |
| CPU (running) | 12.2% | 3.4% |
IO:WALSync |
7.5% | — |
A dash means the state did not reach the eight most frequent in that run. Samples: 2,354 at 25 connections, 24,626 at 400.
The share of time backends spend actually running fell from 12.2% to 3.4%. Four hundred backends contend on one write-ahead log insertion lock, and the ProcArrayGroupUpdate line — twenty times its share at 25 connections — is backends queuing to announce that their transaction has finished. Every connection you add makes the snapshot and commit bookkeeping that every other connection depends on a little more expensive. That is why the curve bends down rather than flattening out, and it is the same wall a Postgres job queue hits at 16 workers.
How much memory does an idle Postgres connection use?
This is where the standard answer — "look at RSS" — is actively wrong. Ten and 200 idle connections, each having run one small query first so its catalog caches are populated, measured twice with near-identical results:
| Metric | 10 connections | 200 connections | Per connection |
|---|---|---|---|
Sum of backend VmRSS |
342 MB | 6,906 MB | 35.1 MB |
of which RssShmem (shared buffers) |
221 MB | 4,480 MB | 22.9 MB |
of which RssFile (the binary) |
90 MB | 1,812 MB | 9.3 MB |
of which RssAnon (private) |
30 MB | 612 MB | 3.1 MB |
| Container memory (cgroup) | 1.169 GiB | 1.528 GiB | 1.9 MiB |
Adding up per-process RSS gives 6.9 GB inside a container hard-limited to 4 GB, which should be enough to tell you the sum is meaningless. Most of each backend's RSS is shared_buffers pages and the Postgres binary — counted once per process, existing once in total.
The honest figure is the cgroup delta: 368 MiB for 190 additional connections, 1.9 MiB each. Even RssAnon overstates it at 3.1 MB, because forked backends share copy-on-write pages with the postmaster.
So 500 idle connections is under a gigabyte — another reason the "just raise it" advice survives contact with production. The caveat is that this is idle cost. work_mem is allocated per sort or hash node, not per connection, so a plan with four hash joins can claim 4 × work_mem on each connection at once. At work_mem=4MB and 400 connections that is a 6.4 GB tail risk on a 4 GB box, and it is why reading the plan matters.
How expensive is opening a connection?
This is the number that justifies a pooler. One client, 12-second runs, three repetitions, all values within 0.5% of each other:
| What the client does | Connection time | Transaction latency | tps |
|---|---|---|---|
| Reuses one connection | — | 0.052–0.053 ms | 19,013–19,350 |
| Opens a new one each time (SCRAM) | 2.861–2.867 ms | 3.083–3.089 ms | 324 |
| Opens a new one each time (trust) | 0.768–0.773 ms | 0.982–0.988 ms | 1,013–1,018 |
A SELECT against a prewarmed table takes 0.052 ms. Getting a connection to run it on takes 2.86 ms — 55 times longer than the work itself. At 10 concurrent clients the gap is wider still: 157,078–162,503 tps with persistent connections against 830–882 tps when each transaction reconnects. A factor of 184.
The third row is the part nobody mentions. Switch pg_hba.conf to trust and the handshake drops from 2.86 ms to 0.77 ms. SCRAM-SHA-256 runs 4,096 rounds of PBKDF2 by design, and that deliberate slowness is 2.09 ms — 73% of the cost of opening a connection. It is doing its job; you just do not want to pay for it on every HTTP request.
We also hit this by accident: at roughly 2,000 connections per second the client container ran out of ephemeral ports and pgbench died with Cannot assign requested address. Sockets in TIME_WAIT accumulate faster than the kernel retires them. Churn breaks the client before it breaks Postgres.
Does pgbouncer make it faster?
Not if your application already holds its connections. pgbouncer 1.25.2 in transaction mode, default_pool_size=25, direct and pooled runs executed back to back at each client count so drift affects both:
| Clients | Direct (pass 1 / pass 2) | Via pgbouncer (pass 1 / pass 2) |
|---|---|---|
| 50 | 79,675 / 46,767 | 52,484 / 31,843 |
| 100 | 71,503 / 43,565 | 56,294 / 36,037 |
| 200 | 59,814 / 43,244 | 51,633 / 43,851 |
| 400 | 34,636 / 34,120 | 34,074 / 43,449 |
At 50 and 100 clients pgbouncer cost 30-34% of throughput in both passes. It breaks even around 200. We expected a clear win at high client counts and did not get one: an extra process hop on every statement is not free, and pgbouncer is single-threaded. At 400 clients it sat at 98.4% of one core while Postgres dropped to 318% — the pooler had become the bottleneck, capping the system at about 44,450 tps.
Where it wins is churn. Fifty clients reconnecting on every transaction:
| Auth method | Direct (tps) | Via pgbouncer (tps) | Gain |
|---|---|---|---|
| SCRAM-SHA-256 | 683 / 753 / 729 | 824 / 950 / 986 | 1.3x |
| trust | 1,935 / 1,979 / 1,992 | 9,098 / 12,761 / 13,132 | 6.5x |
The gap between those rows is the finding. pgbouncer removes the cost of forking a Postgres backend. It cannot remove the cost of authenticating the client to pgbouncer — that handshake still happens, still runs SCRAM, still costs 2 ms. With authentication out of the picture the pooler is worth 6.5x; with SCRAM in front of it, 1.3x.
The admission-control benefit is unaffected by any of this. With 400 application clients connected, pg_stat_activity showed 26 client backends and pgbouncer's own resident memory was 9.2 MB.
So what should max_connections be?
The framing is wrong, and that is most of the problem. max_connections is not a target, it is a fuse. The number that determines your performance is the pool size — how many connections your application actually keeps busy. For a read-mostly workload on N cores, from these measurements:
- Set the pool to about 4 x N. That was the measured peak at both 2 and 4 cores. Anything from 2x N to 6x N is within 10-15% of peak, so there is no need to be precise — bias low, because latency is what you lose by guessing high.
- Set
max_connectionsto a few times the pool size, sized by memory, not by hope. At 1.9 MiB per idle connection plus yourwork_memtail, 500 is under a gigabyte on this box. It exists so a migration, apsqlsession or a replication slot can always get in. - If you are raising
max_connectionsbecause you keep hitting it, you have a pooling bug, not a capacity limit. Something is opening connections it does not need, or not returning them. - Add a pooler for the reason it helps you. Connection churn: measurably yes. Admission control at 400+ clients: yes, 26 backends instead of 400. Making an already-pooled app faster: no — it cost us 30% at 50 clients.
The one number worth memorising is 3.09 ms against 0.052 ms. Everything else here is a curve with a gentle slope. That one is a cliff.
Check it yourself
Four blocks, about four minutes. They reproduce the peak, the latency explosion, the connection cost and the memory cost.
docker network create cite-conn-net
docker run --rm -d --name cite-conn-pg --network cite-conn-net --cpus=4 --shm-size=1g \
  -e POSTGRES_PASSWORD=demo -p 55581:5432 postgres:16 \
  -c max_connections=600 -c shared_buffers=1GB
docker run --rm -d --name cite-conn-bench --network cite-conn-net --cpus=4 \
  --sysctl net.ipv4.ip_local_port_range="10000 65535" \
  --entrypoint sleep postgres:16 infinity
until docker exec cite-conn-pg pg_isready -U postgres >/dev/null 2>&1; do sleep 1; done
docker exec -e PGPASSWORD=demo cite-conn-bench pgbench -h cite-conn-pg -U postgres -i -s 50 -q postgres
1. Find the peak. Ours: 38,952 tps at 5 clients, 72,254 at 16, 65,068 at 50, 33,239 at 400 — and latency 0.128 ms, 0.221 ms, 0.768 ms, 12.034 ms.
for c in 5 16 50 400; do
  printf "%4s clients: " $c
  docker exec -e PGPASSWORD=demo cite-conn-bench pgbench -h cite-conn-pg -U postgres -n \
    -b select-only@9 -b simple-update@1 -c $c -j 4 -T 15 postgres 2>&1 \
    | grep -E '^tps|^latency average' | tr '\n' ' '; echo
done
2. Price a connection. Ours: 0.054 ms to run the query on a connection you already have, 2.877 ms to get a new one.
docker exec -e PGPASSWORD=demo cite-conn-bench pgbench -h cite-conn-pg -U postgres -n -S \
  -c 1 -j 1 -T 10 postgres 2>&1 | grep -E '^tps|^latency average'
docker exec -e PGPASSWORD=demo cite-conn-bench pgbench -h cite-conn-pg -U postgres -n -S -C \
  -c 1 -j 1 -T 10 postgres 2>&1 | grep -E '^tps|^latency average|^average connection'
3. Price idle connections. Ours: 1003 MiB at 10, 1.318 GiB at 200 — 1.8 MiB each.
for n in 10 200; do
  for i in $(seq 1 $n); do
    docker exec -e PGPASSWORD=demo cite-conn-bench psql -h cite-conn-pg -U postgres -qtA \
      -c "SELECT count(*) FROM pgbench_accounts WHERE aid < 2000" \
      -c "SELECT pg_sleep(40)" postgres >/dev/null 2>&1 &
  done
  sleep 18
  echo "$n idle connections: $(docker stats --no-stream --format '{{.MemUsage}}' cite-conn-pg)"
  wait
done

docker rm -f cite-conn-pg cite-conn-bench && docker network rm cite-conn-net
Your absolute numbers should differ from ours. The two that ought to survive the move to your hardware are the ratio in step 2 — a new connection costing tens of times more than the query it runs — and the peak in step 1 sitting at roughly four times your core count — for this workload.
A caveat worth stating, because it changes the number. This benchmark runs a 9:1 read/update mix. Re-running it as pure select-only on two dedicated cores, with the load generator on separate CPUs, the peak moves down to 4 clients — twice the core count, not four times:
| Clients | tps (select-only, 2 cores) |
|---|---|
| 2 | 37,488 |
| 4 | 72,570 |
| 8 | 64,422 |
| 16 | 62,703 |
| 32 | 57,957 |
Updates wait on I/O, and a client waiting on I/O is not holding a core — so a write-mixed workload sustains more concurrency before it peaks. A pure in-memory read workload saturates CPU sooner and peaks earlier.
So the honest rule is a small multiple of your core count — roughly 2x to 4x, depending on how much your workload waits — and emphatically not the hundreds that max_connections lets you configure. Measure your own mix; the shape is universal, the multiplier is not.