Is Docker slower than running natively?
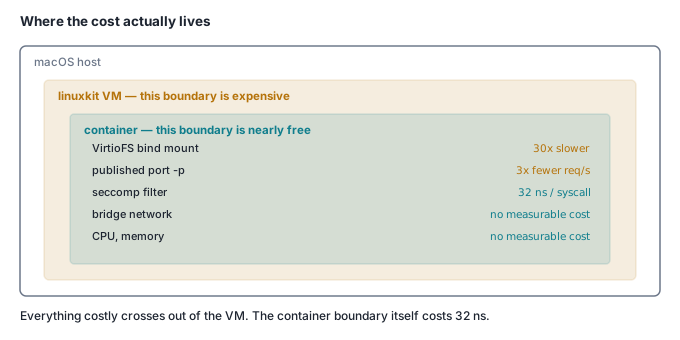
We benchmarked the same Node workload natively and in a container on an M3 Mac. CPU, memory and container-to-container networking were free. A bind mount cost 30x against a named volume. Almost none of that is Docker's fault — it is the Linux VM macOS runs it in, and on Linux most of this article do

On Linux, no — a container is a normal process with some kernel bookkeeping, and the only overhead I could isolate was about 32 nanoseconds per syscall. On macOS, yes, sometimes badly — but what you are measuring there is a Linux virtual machine, not a container. Every benchmark below ran on a Mac, which makes this as much a warning about benchmarks as a set of numbers.
The distinction is almost never made. Someone runs a build in a container on their MacBook, watches it take four times as long, and blames Docker. Docker was not involved: the files crossed a VirtioFS boundary between two operating systems, and that boundary does not exist on the server the image will run on.
The short answer
- A container adds nothing measurable to CPU-bound code. An integer loop ran 64.0 ms natively and 64.1–64.3 ms in a container; 400 MiB of SHA-256 took 145–148 ms on both sides. The one operation that differed, double modulo, traced to the platforms'
fmod— a libc difference whose direction reverses depending on your operands, not a container one. - The only container cost isolatable on a Linux kernel was seccomp: about 32 ns per syscall, or 8% on a workload doing nothing but
stat— 437 ns with Docker's default profile, 405 ns withseccomp=unconfined. That one transfers to Linux. - On macOS the bind mount is the expensive thing, and it is not Docker's doing. Unpacking 10,401 files took 92–120 ms on a named volume and 3,021–4,083 ms on a bind mount — a 30x gap, all of it VirtioFS crossing between macOS and the VM.
- Docker's bridge network is free; publishing a port to macOS is not. Container-to-container ran at 14,056–15,173 req/s, identical to loopback inside a single container (11,619–14,930). Reaching a container from macOS through
-pcost 3x: 6,672–8,463 req/s against 24,140–28,651 native. - Memory is a wash per process, and 7.75 GiB up front for the VM. The same Node server reported 53.7–53.8 MiB RSS natively, 54.7–55.0 MiB containerised; Docker Desktop's own macOS processes held 509 MiB.
What I measured, and what I did not
I did not measure Docker on Linux. Every "native" number is macOS-native and every "container" number is inside Docker Desktop's Linux VM: two operating systems, two C libraries, two Node builds. That is the comparison people make on a laptop, not a measurement of containerisation. Comparisons within the VM hold virtualisation constant, and those I would trust on a server.
Hardware: Apple M3, 4 performance and 4 efficiency cores, 16 GB RAM, macOS 26.4.1 (build 25E253). Docker Desktop 4.75.0 (227598), engine 29.5.2, guest kernel 6.12.76-linuxkit aarch64, 8 vCPUs, 7.75 GiB of guest RAM, overlay2 on ext4, VirtioFS file sharing — confirmed from inside the VM:
virtiofs0 on /run/host_virtiofs/Users type virtiofs.virtiofs0 (rw,...)
/run/host_virtiofs/Users on /run/host_mark/Users type fakeowner (rw,...)
Both sides run Node v23.5.0, V8 12.9.202.28-node.12, arm64 — no emulation, no Rosetta — but they are not identical builds: the macOS binary is compiled with clang, the node:23.5.0-bookworm-slim one with gcc, against a different libc. That matters exactly once, below. Every measurement ran at least three times, alternating host and container, and I report the spread. Two unrelated containers were running throughout.
Does a container slow down CPU-bound code?
No. Forty million iterations, alternating passes, host against container:
| Kernel (40M iterations) | Host, macOS | Container, Linux VM |
|---|---|---|
| integer xorshift | 64.0 ms | 64.1 ms |
| SHA-256, 400 MiB (OpenSSL) | 145.3 ms | 146.0 ms |
Math.sqrt only |
23.4 ms | 22.8 ms |
| float divide only | 32.1 ms | 30.0 ms |
| integer modulo | 127.8 ms | 128.3 ms |
One operation refused to match, and chasing it took longer than everything else here combined. A loop doing x = x % 1e9 on doubles ran 171.5 ms on the host against 107.0 ms in the container — 60% faster inside, reproducibly. A container cannot do that.
V8 compiles a double % into a call to the platform's fmod — verified, not assumed, by interposing the symbol and counting. A C control calling fmod three million times reports exactly three million, and so do three million JS % operations:
Linux,  LD_PRELOAD shim           C control 3000000    node 3000001
macOS,  DYLD_INSERT_LIBRARIES     C control 3000000    node 3000001
So this is a libm result, not a V8 one, and the two libms have different shapes. Same C source, same compiler both sides (clang -O2, -fno-builtin-fmod), 20M operations:
fmod operand pattern |
Apple libm | glibc 2.36 | Faster |
|---|---|---|---|
serial dependency, x % 1e9 |
79.0 ms | 37.3 ms | glibc, 2.1x |
independent, (i*1.1) % 1e9 |
34.6 ms | 37.2 ms | Apple, 1.1x |
independent, (i*1.1) % 7.3 |
375.6 ms | 480.9 ms | Apple, 1.3x |
serial dependency, x % 7.3 |
96.4 ms | 54.9 ms | glibc, 1.8x |
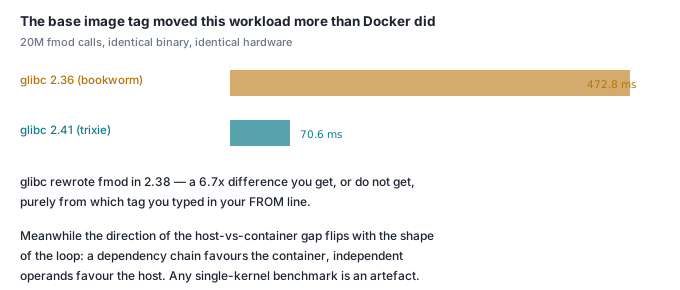
The direction reverses with the operands, and the JS numbers track these within loop overhead. Apple's fmod has higher latency but pipelines better, so dependency chains favour glibc and independent operands favour Apple. My kernel was a dependency chain; write the loop the other way and the host wins. Any single-kernel claim about whose fmod is faster — this article's own draft included — is an artefact of the loop.
There is a Docker-specific sting underneath. glibc rewrote fmod in 2.38, and node:23.5.0-bookworm-slim is built on Debian bookworm, which ships 2.36:
(i*1.1) % 7.3, 20M ops |
glibc 2.36 | glibc 2.41 |
|---|---|---|
| gcc 14 -O2 | 477.4 ms | 70.6 ms |
Your base image's libc version moved this workload 6.8x — far more than containerisation did anywhere on this page. Containers do not touch CPU: on Linux a container is a process, it just has different numbers in /proc.
What does container isolation actually cost?
One thing, and it is measurable: every syscall from a container passes Docker's default seccomp BPF filter. Two million stat calls, identical image and file, five runs each:
| Configuration | p50 of 2M stats | Per syscall |
|---|---|---|
| Container, default seccomp | 862–920 ms | 431–460 ns |
Container, seccomp=unconfined |
807–811 ms | 404–405 ns |
| macOS, native (for scale) | 2,421–2,608 ms | 1,211–1,304 ns |
Seccomp costs about 32 ns per syscall, or 8% of a pure-syscall workload. Both container rows ran on the same kernel with virtualisation held constant, so this is the one figure I would expect to reproduce on a Linux server — and on any real workload, where syscalls are punctuation rather than the sentence, it disappears. Note too that macOS stat is three times slower than Linux stat: another platform difference, not a container one.
How slow is a Docker bind mount on macOS?
This is the real answer to "why is Docker slow on my Mac". Unpacking a 39 MB tarball of 10,401 small files — a node_modules in all but name — into each place a container writes:
| Destination | Untar 10,401 files | vs named volume |
|---|---|---|
| Named volume (ext4 in the VM) | 92 / 104 / 120 ms | 1.0x |
| Container writable layer (overlay2) | 117 / 121 / 123 ms | 1.2x |
| macOS native, for reference | 1,010 / 1,010 / 1,080 ms | ~10x |
| Bind mount from the host (VirtioFS) | 3,021 / 3,131 / 4,083 ms | ~30x |
The host row uses bsdtar against GNU tar, so treat it as indicative; the three container rows are the same binary on the same kernel. A pure-Node benchmark, identical code in each location, four samples each:
| Location | Create, files/sec | Stat + read, files/sec | Sequential read |
|---|---|---|---|
| Named volume | 62,952–154,150 | 200,097–289,992 | 7.8–14.5 GiB/s |
| Container layer | 69,736–104,284 | 249,149–258,252 | 8.4–18.1 GiB/s |
| macOS native (APFS) | 13,789–15,259 | 39,725–69,080 | 11.1–16.1 GiB/s |
| Bind mount | 4,474–6,210 | 14,323–15,532 | 1.8–2.6 GiB/s |
Two things stand out. The bind mount is 3–10x slower than everything else on small-file work and 5x slower on sequential reads — VirtioFS paying macOS a visit for every metadata operation. And, more surprising, the VM's ext4 is roughly ten times faster than APFS at creating small files, because APFS does copy-on-write metadata and checksums that ext4 does not. On macOS a named volume is not merely faster than a bind mount; it is faster than not using Docker.
Sequential bulk writes I could not separate: host 521–2,764 MiB/s against the VM at 548–1,510 MiB/s, fully overlapping. Reads come from page cache everywhere, so read that column as the path, not the disk.
Hence the bind mount versus volume choice: source you edit on a bind mount, everything the container generates — node_modules, build caches, database files — on a named volume.
Does Docker networking cost anything?
The bridge does not. Crossing to macOS does. Four seconds of keep-alive requests for a 1 KiB body on one connection, three passes:
| Path | Requests/sec | p50 latency |
|---|---|---|
| macOS native → macOS native (loopback) | 24,140–28,651 | 0.033–0.042 ms |
| Container → container (bridge network) | 14,056–15,173 | 0.067–0.068 ms |
| Client + server in one container (loopback) | 11,619–14,930 | 0.064–0.067 ms |
macOS → container via published port -p |
6,672–8,463 | 0.116–0.130 ms |
Row three is the control that makes the rest readable: no bridge, no NAT, no port publishing — just loopback inside one container — and it matches row two. Docker's bridge network, NAT included, cost nothing measurable. The gap between rows one and two is the VM's syscall and scheduling path, the same tax the stat benchmark showed.
Row four is the one to remember: publishing a port to macOS costs about 0.08 ms per request, roughly 3x the throughput, because every packet is proxied across the VM boundary. Benchmark a containerised service from your Mac and you are measuring that proxy. For scale, TLS on the same response costs 0.010 ms: the plumbing is eight times the crypto.
How long does a container take to start?
Five rounds, timed from "go" until an HTTP request returns 200:
| Start | p50 | Range |
|---|---|---|
node server.mjs natively |
113 ms | 72–197 ms |
docker start on an existing container |
189 ms | 123–293 ms |
docker run (create + start + serve) |
288 ms | 224–463 ms |
docker run --rm alpine:3.24 true (does nothing) |
272 ms | 205–288 ms |
The last row is the giveaway: an empty container running true costs almost as much as one that boots Node and serves traffic. The ~175 ms premium over native is not the container starting — it is the CLI talking to the daemon across the VM boundary and back.
Does a container use more memory?
Per process, no. The same Node server reporting its own RSS:
| Idle | After allocating | Heap used | |
|---|---|---|---|
| Host, macOS | 53.7–53.8 MiB | 60.9–61.0 MiB | 12.0 MiB |
| Container | 54.7–55.0 MiB | 61.1–61.5 MiB | 12.0 MiB |
About 1 MiB apart with identical heaps — glibc against Apple's allocator again, not container overhead. On Linux a container's memory is the process's memory: the same page table with a cgroup counter attached.
The macOS bill is elsewhere. Docker Desktop's eleven host processes held 509 MiB of RSS, and the VM is configured with 7.75 GiB, of which the guest reported 477 MiB in use and 7.3 GiB as page cache — the cost of having Docker running at all. On Linux that is zero: dockerd is a daemon, not a machine.
What would be different on Linux?
This section is reasoning, not measurement. I could not run Linux-native containers, so these are predictions to check on your own hardware, not numbers to quote.
The bind mount cost should vanish entirely. There is no VirtioFS on Linux; -v /host:/container is a kernel bind mount onto the same inodes the host uses. The 30x becomes 1x, and the choice between mount types stops being about performance.
The published-port cost should mostly vanish too: -p on Linux is an iptables DNAT rule, not a userspace proxy crossing a hypervisor. Startup should shed most of the 175 ms, since the daemon round trip becomes a local Unix socket. CPU and memory should stay at parity, because they already are. The figure that should survive intact is seccomp's 32 ns per syscall — that filter runs on the same kernel either way. The libc finding does not go away — your base image still picks your fmod on any host.
So what is actually Docker's fault?
Almost none of it. Of everything measured here the container is responsible for one number: 32 nanoseconds per syscall, from the seccomp filter. The 30x bind mount, the 3x published port and most of the 175 ms startup premium belong to the macOS/Linux boundary Docker Desktop bridges. The libc gap belongs to your base image. Neither is containerisation.
On a Mac: keep generated files off bind mounts, benchmark from inside the network you are benchmarking, and stop blaming containers for either. On Linux: the image you ship runs at native speed, whatever your laptop told you.
Check it yourself
Two numbers, one file, about ninety seconds. The CPU loop is integer-only on purpose — after the last section, no benchmark of mine goes near libm again.
mkdir dkr-check && cd dkr-check
Save this as bench.mjs:
// Two numbers: CPU the container cannot touch, and file metadata it can.
import fs from 'node:fs';
import path from 'node:path';
const DIR = process.argv[2], LABEL = process.argv[3];
const ms = (t) => Number(process.hrtime.bigint() - t) / 1e6;

function cpu() {                          // integer only: no libm, no syscalls
  let x = 123456789 | 0;
  for (let i = 0; i < 40_000_000; i++) { x ^= x << 13; x ^= x >>> 17; x ^= x << 5; x = x | 0; }
  return x;
}
function files() {                        // 2,000 small files: all metadata
  fs.rmSync(DIR, { recursive: true, force: true });
  fs.mkdirSync(DIR, { recursive: true });
  const buf = Buffer.alloc(4096, 0x7a);
  const t = process.hrtime.bigint();
  for (let i = 0; i < 2000; i++) fs.writeFileSync(path.join(DIR, `f${i}.dat`), buf);
  const r = Math.round(2000 / (ms(t) / 1000));
  fs.rmSync(DIR, { recursive: true, force: true });
  return r;
}
const med = (f) => { const a = [f(), f(), f()].sort((x, y) => x - y); return a[1]; };
cpu();                                    // warm up
const c = med(() => { const t = process.hrtime.bigint(); cpu(); return +ms(t).toFixed(0); });
console.log(`${LABEL.padEnd(26)} cpu ${String(c).padStart(4)} ms   files ${String(med(files)).padStart(6)}/sec`);
Match the image to your own Node version, or the comparison means nothing:
docker volume create cite-dkr-demo
IMG=node:23.5.0-bookworm-slim

node bench.mjs "$PWD/work" "host, native"
docker run --rm -v "$PWD:/w" -w /w -v cite-dkr-demo:/vol $IMG node bench.mjs /w/work   "container, bind mount"
docker run --rm -v "$PWD:/w" -w /w -v cite-dkr-demo:/vol $IMG node bench.mjs /vol/work "container, named volume"
Three consecutive runs on the machine described above:
host, native               cpu   64 ms   files  17193/sec
container, bind mount      cpu   64 ms   files   6050/sec
container, named volume    cpu   64 ms   files 140982/sec

host, native               cpu   64 ms   files  17504/sec
container, bind mount      cpu   64 ms   files   6043/sec
container, named volume    cpu   69 ms   files 145446/sec

host, native               cpu   68 ms   files  13874/sec
container, bind mount      cpu   71 ms   files   5768/sec
container, named volume    cpu   71 ms   files 139440/sec
Clean up:
docker volume rm cite-dkr-demo && cd .. && rm -rf dkr-check
The CPU column is flat within noise — the container costing nothing. The files column moves 24x between the two container rows, which are the same Docker, the same image, the same command. Only the mount changed. Run it on Linux and the bind-mount row should join the other two.