Which schema changes lock your table?
Of eighteen DDL statements measured on a 10-million-row Postgres 16.15 table, three rewrote it and froze every read and write for about 8 seconds. The other fifteen finished in under a second — and one of the cheap ones still stopped reads for 18 seconds.
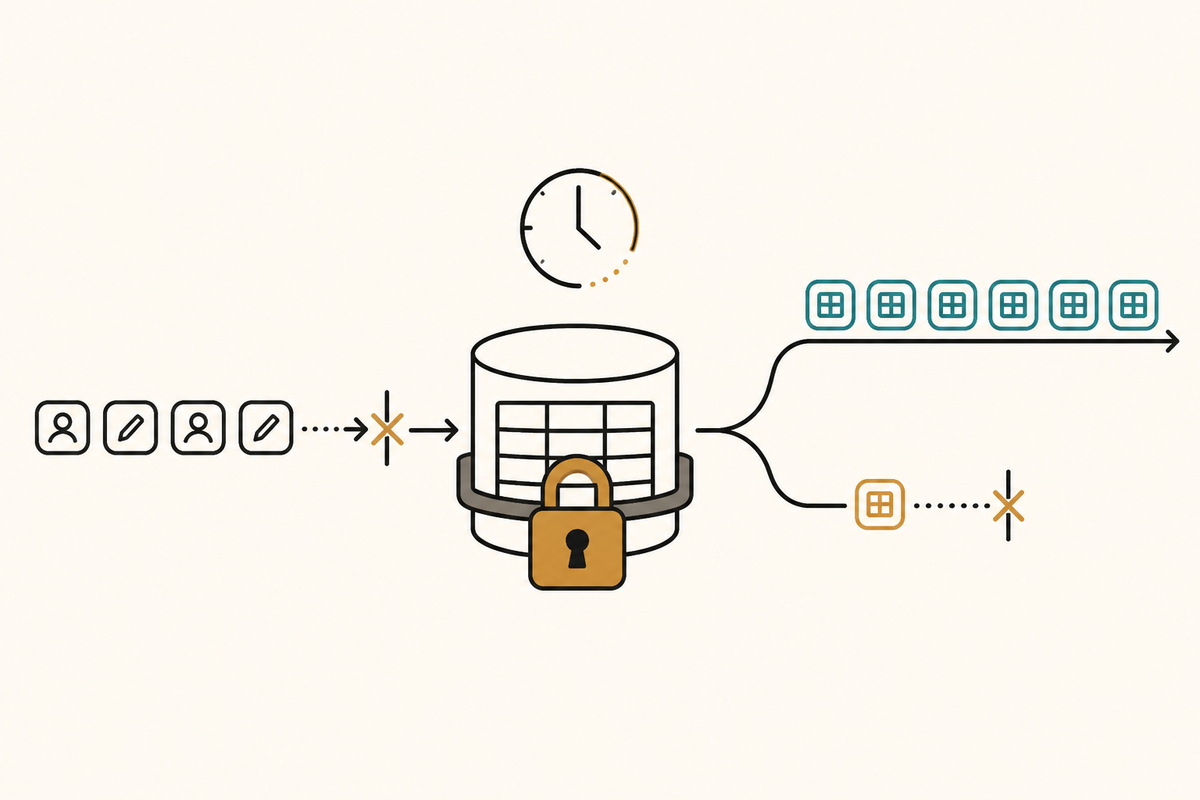
Three of the eighteen statements I measured rewrote the table, and each of those blocked every read and every write on 10 million rows for 7.6 to 8.7 seconds; the other fifteen finished in under 1.3 seconds. The rewrite is the thing to look for, not the lock name — but the worst result in the whole set came from a statement that did no work at all. ALTER TABLE t ADD COLUMN zz int is instant. Queued behind one ordinary 20-second read transaction, it stopped five plain single-row SELECTs for 16.8 to 18.0 seconds each.
That is the trap. The migration you were worried about is usually fine. The migration that hurts is the one that waits.
The short answer
- On Postgres 16.15, a table rewrite runs at 0.73 seconds per million rows on this hardware — 0.75 s at 1M rows, 3.47 s at 5M, 6.91 s at 10M, 14.78 s at 20M. Linear. At 50M rows that is roughly 37 seconds of frozen table on fast local NVMe, and considerably worse on network storage.
ADD COLUMN ... DEFAULT 7does not rewrite the table on Postgres 16. It took 0.02 s on 10M rows and blocked nothing measurable.ADD COLUMN ... DEFAULT random()does rewrite: 7.44 s, with reads blocked 7.70 s and writes 7.61 s.ALTER COLUMN TYPEis not one operation.varchar(50)→varchar(100)andvarchar(50)→texttook 0.01 s and rewrote nothing.varchar(50)→varchar(20)andint→bigintrewrote the table and blocked reads for 8.45 s and 8.52 s.ADD FOREIGN KEYnever blocked reads at all — it takes SHARE ROW EXCLUSIVE, not ACCESS EXCLUSIVE. Writes stopped for 1.20 s; the read stream peaked at 0.02 s, which is the noise floor.- A migration waiting for a lock blocks every query that arrives behind it, including reads. Five point-
SELECTs queued behind a blockedADD COLUMNwaited 16.79–18.03 s. WithSET lock_timeout = '2s'on the migration, the same five waited 0.03–1.03 s and the migration failed cleanly at 2.04 s. CREATE INDEX CONCURRENTLYcost 1.63x the wall time (3.09 s vs 1.89 s) and cut peak write latency from 2.30 s to 0.17 s. Cancelled at the wrong moment it left a 70 MB index withindisvalid = falseandindisready = true— maintained on every write, used by no query.
What was measured, and on what
Apple M3, 8 cores, 16 GB RAM, macOS 26.4.1. Docker 29.5.2 with 8 CPUs and 8.32 GB visible to the VM. postgres:16, which is PostgreSQL 16.15 (Debian 16.15-1.pgdg13+2) on aarch64, started with shared_buffers=512MB, maintenance_work_mem=512MB, work_mem=64MB, max_wal_size=8GB, --shm-size=1g.
Version matters more here than in most articles. Cheap ADD COLUMN with a constant default arrived in Postgres 11. SET NOT NULL learned to skip its scan when a validated CHECK already proves the column non-null in Postgres 12. Everything below is 16.15 and I do not claim it for other majors.
The table is 10,000,000 rows of (id int, amount int, code varchar(50), note text, created_at timestamptz) with a primary key on id. That is 730 MB of heap and 945 MB including the index.
Concurrency is two pgbench clients on persistent connections, each capped at 20 transactions per second, with per-transaction latency logged:
-- reader
SELECT amount FROM t WHERE id = :id;
-- writer
UPDATE t SET amount = amount + 1 WHERE id = :id;
"Blocked" is the maximum single-transaction latency during the window. The control run, with no DDL at all, peaked at 0.01 s for reads and 0.02 s for writes — that is the floor, and anything at that level in the table below means nothing was blocked. Lock modes come from pg_locks in a third session.
Each operation ran twice: once alone for wall time, once with the reader and writer running. The table below reports the concurrent run.
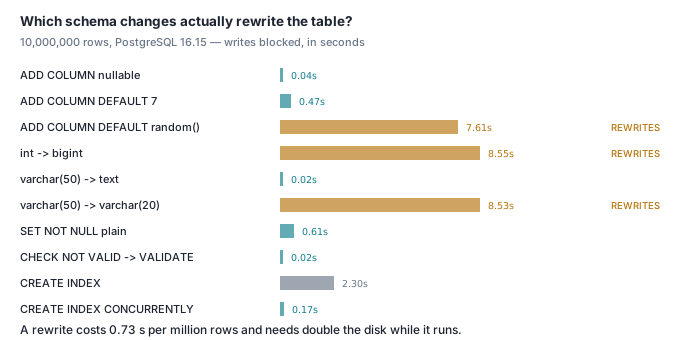
Which schema changes lock your table?
10M rows, Postgres 16.15, on the hardware above. Wall time and blocking are from the same run.
| Operation | Lock on the table | Rewrites? | Wall time | Writes blocked | Reads blocked |
|---|---|---|---|---|---|
ADD COLUMN c int |
ACCESS EXCLUSIVE | no | 0.03 s | 0.04 s | 0.04 s |
ADD COLUMN c int NOT NULL DEFAULT 7 |
ACCESS EXCLUSIVE | no | 0.13 s | 0.47 s | 0.01 s |
ADD COLUMN c float NOT NULL DEFAULT random() |
ACCESS EXCLUSIVE | YES | 7.87 s | 7.61 s | 7.70 s |
ALTER COLUMN id TYPE bigint (PK column) |
ACCESS EXCLUSIVE | YES | 8.69 s | 8.55 s | 8.52 s |
ALTER COLUMN code TYPE varchar(100) |
ACCESS EXCLUSIVE | no | 0.04 s | 0.03 s | 0.02 s |
ALTER COLUMN code TYPE text |
ACCESS EXCLUSIVE | no | 0.04 s | 0.02 s | 0.02 s |
ALTER COLUMN code TYPE varchar(20) |
ACCESS EXCLUSIVE | YES | 8.65 s | 8.53 s | 8.45 s |
ALTER COLUMN note SET NOT NULL |
ACCESS EXCLUSIVE | no | 0.65 s | 0.61 s | 0.57 s |
ADD CONSTRAINT ... CHECK ... NOT VALID |
ACCESS EXCLUSIVE | no | 0.03 s | 0.02 s | 0.01 s |
VALIDATE CONSTRAINT (check) |
SHARE UPDATE EXCLUSIVE | no | 0.56 s | 0.02 s | 0.01 s |
SET NOT NULL after a validated CHECK |
ACCESS EXCLUSIVE | no | 0.03 s | 0.01 s | 0.01 s |
ADD FOREIGN KEY |
SHARE ROW EXCLUSIVE | no | 1.24 s | 1.20 s | 0.02 s |
ADD FOREIGN KEY ... NOT VALID |
SHARE ROW EXCLUSIVE | no | 0.07 s | 0.01 s | 0.01 s |
VALIDATE CONSTRAINT (FK) |
SHARE UPDATE EXCLUSIVE | no | 0.95 s | 0.03 s | 0.01 s |
CREATE INDEX |
SHARE | no | 2.36 s | 2.30 s | 0.01 s |
CREATE INDEX CONCURRENTLY |
SHARE UPDATE EXCLUSIVE | no | 3.59 s | 0.17 s | 0.01 s |
DROP COLUMN note |
ACCESS EXCLUSIVE | no | 0.04 s | 0.02 s | 0.02 s |
RENAME COLUMN |
ACCESS EXCLUSIVE | no | 0.04 s | 0.01 s | 0.02 s |
| control: no DDL | — | — | — | 0.02 s | 0.01 s |
Ten of these take ACCESS EXCLUSIVE and eight of those ten block nothing you can measure, because they finish in the time it takes to update a catalogue row. The lock name is a poor predictor. Rewrite is the predictor.
DROP COLUMN deserves a note: the heap was 765,607,936 bytes before and 765,607,936 bytes after. Dropping a column is a catalogue edit. The data stays on disk until every row is rewritten by something else.
Does ADD COLUMN with a default still rewrite the table?
Not for a constant. Postgres 11 added a "missing value" mechanism and it is alive and well in 16.15 — you can see it in the catalogue:
ALTER TABLE d1 ADD COLUMN a int NOT NULL DEFAULT 7;
ALTER TABLE d2 ADD COLUMN b double precision NOT NULL DEFAULT random();

SELECT attrelid::regclass AS tbl, attname, atthasmissing, attmissingval
  FROM pg_attribute WHERE attnum > 0 AND attrelid IN ('d1'::regclass,'d2'::regclass);
 tbl | attname | atthasmissing | attmissingval
-----+---------+---------------+---------------
 d1  | a       | t             | {7}
 d2  | b       | f             |
d1 stores the value 7 once, in pg_attribute, and synthesises it for every row that predates the column. d2 has nothing stored because there was nothing constant to store — every row needed its own random(), so the table was rewritten. That is the whole rule: a default the planner can fold to a constant is free; a volatile one costs a full rewrite.
The cost of getting it wrong is not subtle. During the 10M-row rewrite, the database's on-disk size peaked at 4.12 GB and settled at 3.13 GB — the rewrite built a complete second copy, 944 MB of it, before releasing the original. A rewrite needs double the free space, and it needs it all at once.
Why does varchar(50) → varchar(100) not rewrite, but varchar(50) → varchar(20) does?
Because widening a varchar cannot invalidate any existing row and narrowing it can. Postgres has a "binary coercible without verification" fast path, and varchar(n) → varchar(bigger) and varchar(n) → text both qualify. Going the other way, every row must be checked, and Postgres checks by rewriting.
| Wall time | Rewrote? | |
|---|---|---|
varchar(50) → varchar(100) |
0.04 s | no |
varchar(50) → text |
0.04 s | no |
varchar(50) → varchar(20) |
8.65 s | yes |
int → bigint is the same story with worse economics: the on-disk width changes, so 8.69 s of frozen table at 10M rows, and the primary key index is rebuilt with it. This is the argument that runs underneath UUID vs bigint primary keys — pick the wide type at CREATE TABLE time or pay for it under an ACCESS EXCLUSIVE lock later.
Why didn't ADD FOREIGN KEY block reads?
This one contradicted what I expected to measure. ALTER TABLE ... ADD FOREIGN KEY does not take ACCESS EXCLUSIVE on the referencing table. pg_locks says:
ADD FOREIGN KEY plain     | AccessShareLock, ShareRowExclusiveLock
ADD FOREIGN KEY NOT VALID | AccessShareLock, ShareRowExclusiveLock
VALIDATE CONSTRAINT (FK)  | AccessShareLock, ShareUpdateExclusiveLock
SHARE ROW EXCLUSIVE conflicts with writers, not with readers. The measurement agrees: writes peaked at 1.20 s, reads at 0.02 s, which is the control's noise. So the two-step NOT VALID / VALIDATE dance for foreign keys buys you 1.18 seconds of write availability here, not the read outage you may have been told to fear.
The NOT NULL case is the more interesting one, and it is smaller than its reputation too:
| Wall time | Writes blocked | Reads blocked | |
|---|---|---|---|
SET NOT NULL, plain |
0.65 s | 0.61 s | 0.57 s |
ADD CHECK ... NOT VALID |
0.03 s | 0.02 s | 0.01 s |
VALIDATE CONSTRAINT |
0.56 s | 0.02 s | 0.01 s |
SET NOT NULL after that |
0.03 s | 0.01 s | 0.01 s |
Plain SET NOT NULL does a sequential scan under ACCESS EXCLUSIVE. A bare SELECT count(*) on this table takes 567 ms cold and 118 ms warm, so 0.65 s is exactly one scan. The three-step version does the same scan under SHARE UPDATE EXCLUSIVE, which blocks neither reads nor writes, and leaves 0.03 s of exclusive lock. It converts 0.61 s of blocked writes into 0.02 s. On a laptop with the table in cache that is a rounding error. Scale the scan to 50M rows on a server where the table does not fit in RAM and it is the difference between a deploy and an incident.
Why did my reads stop when the migration hadn't even started?
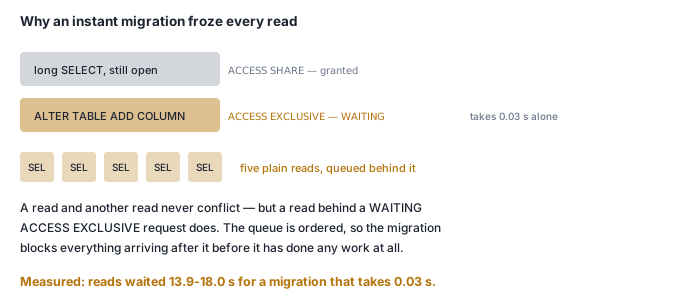
This is the measurement worth the article. Postgres lock requests are queued in arrival order, and a pending strong request blocks everything behind it — even requests that would be perfectly compatible with the lock currently held.
Session A opens an ordinary read transaction and holds it for 20 seconds. Session B runs ALTER TABLE t ADD COLUMN zz int, which takes 0.03 s when unopposed. Five plain point-SELECTs arrive after B. Here is pg_locks three and a half seconds in:
 pid  |        mode         | granted |               query
------+---------------------+---------+------------------------------------
 1959 | AccessShareLock     | t       | BEGIN; SELECT count(*) FROM t WHERE
 1965 | AccessExclusiveLock | f       | ALTER TABLE t ADD COLUMN zz int;
 1971 | AccessShareLock     | f       | SELECT amount FROM t WHERE id = 1000;
 1977 | AccessShareLock     | f       | SELECT amount FROM t WHERE id = 2000;
 1983 | AccessShareLock     | f       | SELECT amount FROM t WHERE id = 3000;
 1989 | AccessShareLock     | f       | SELECT amount FROM t WHERE id = 4000;
 1995 | AccessShareLock     | f       | SELECT amount FROM t WHERE id = 5000;
Every one of those five AccessShareLock requests is compatible with the AccessShareLock that pid 1959 already holds. They wait anyway, because pid 1965 is ahead of them in the queue. What they actually cost:
MIGRATION | 19.04 s |
READER1   | 18.03 s | 0
READER2   | 17.72 s | 0
READER3   | 17.41 s | 0
READER4   | 17.10 s | 0
READER5   | 16.79 s | 0
An instant migration produced a 17-second read outage. In production the reads are not five; they are every connection in the pool, and the pool exhausts.
The fix is one line in the migration session:
SET lock_timeout = '2s';
ALTER TABLE t ADD COLUMN zz int;
Same scenario, rerun:
MIGRATION | 2.04 s  | ERROR:  canceling statement due to lock timeout
READER1   | 1.03 s  | 0
READER2   | 0.72 s  | 0
READER3   | 0.42 s  | 0
READER4   | 0.12 s  | 0
READER5   | 0.03 s  | 0
The migration fails instead of the application. Retry it in a loop; each attempt either gets the lock immediately or gets out of the way within two seconds. The other half of the fix is on the other side of the queue — whatever is holding that transaction open. What one long-running transaction actually blocks is normally nothing at all, right up to the moment a migration lines up behind it.
How much slower is CREATE INDEX CONCURRENTLY, and what does it leave behind?
1.63x slower: 3.09 s against 1.89 s for the plain build, solo, on the same 10M rows producing the same 70 MB index. Under concurrent load the gap holds (3.59 s vs 2.36 s). What you buy is the write availability — peak write latency 0.17 s instead of 2.30 s — because it holds SHARE UPDATE EXCLUSIVE instead of SHARE.
You also buy a failure mode. CREATE INDEX CONCURRENTLY scans the table twice and cannot roll back cleanly. I cancelled it at four points in a 3.1-second build:
| Cancelled at | indisvalid |
indisready |
Index size |
|---|---|---|---|
| 1.0 s | false | false | 0 bytes |
| 2.0 s | false | true | 70 MB |
| 2.6 s | true | true | 70 MB (completed) |
| 2.9 s | true | true | 70 MB (completed) |
The 2.0 s row is the bad one. indisready = true means every INSERT, UPDATE and DELETE maintains that index. indisvalid = false means no query will ever use it — EXPLAIN on a lookup that should have used it returns Parallel Seq Scan. It is pure write cost, which is the wrong half of what each index costs. And retrying the migration does not help:
ERROR: relation "t_ixc" already exists
You must DROP INDEX CONCURRENTLY it first. Find them with:
SELECT c.relname AS invalid_index, t.relname AS on_table
  FROM pg_index i
  JOIN pg_class c ON c.oid = i.indexrelid
  JOIN pg_class t ON t.oid = i.indrelid
 WHERE NOT i.indisvalid;
Run that after every deploy that builds an index concurrently. Nothing else will tell you.
Check it yourself
The lock-queue trap in one script. Postgres 16, one container, about 40 seconds.
docker run -d --name cite-mig-demo -p 55661:5432 -e POSTGRES_PASSWORD=pw \
  -e POSTGRES_DB=mig postgres:16
sleep 8
docker exec cite-mig-demo psql -U postgres -qtAX mig \
  -c "CREATE TABLE t (id int PRIMARY KEY, amount int);
      INSERT INTO t SELECT g, g FROM generate_series(1,1000) g;"

docker exec -i cite-mig-demo bash <<'EOF'
P="psql -U postgres -qtAX mig"
LT=""                       # <-- change to "SET lock_timeout='2s';" and rerun
# A: an ordinary long read transaction
( $P -c "BEGIN; SELECT count(*) FROM t; SELECT pg_sleep(20); COMMIT;" >/dev/null ) &
sleep 1
# B: the migration, which needs ACCESS EXCLUSIVE and cannot have it yet
( S=$(date +%s.%N); O=$($P -c "$LT ALTER TABLE t ADD COLUMN zz int;" 2>&1)
  echo "MIGRATION $(echo "$(date +%s.%N) $S"|awk '{printf "%.2f",$1-$2}')s $O" ) &
sleep 1
# C: five innocent point reads, arriving after the migration
for i in 1 2 3 4 5; do
  ( S=$(date +%s.%N); $P -c "SELECT amount FROM t WHERE id=$i;" >/dev/null
    echo "READER$i   $(echo "$(date +%s.%N) $S"|awk '{printf "%.2f",$1-$2}')s" ) &
  sleep 0.3
done
sleep 1
$P -c "SELECT pid, mode, granted FROM pg_locks l JOIN pg_class c ON c.oid=l.relation
        WHERE c.relname='t' ORDER BY granted DESC;"
wait
EOF

docker rm -f -v cite-mig-demo
With LT empty the five readers wait out the whole transaction. With lock_timeout set they wait at most two seconds and the migration is the thing that fails. On a 1,000-row table nothing rewrites, so every second you see is queueing — which is the point.
Migrations in Workflow Builder run with lock_timeout set and a retry loop around every ACCESS EXCLUSIVE statement, because the statement that takes the outage is almost never the one anybody reviewed.