What does one long-running transaction actually block?
One idle transaction that had read a single row made a Postgres 16 table grow 4x in five minutes under an ordinary write load. It blocked no queries and cost 0.2% of throughput — the damage was disk, and plain VACUUM did not give it back.
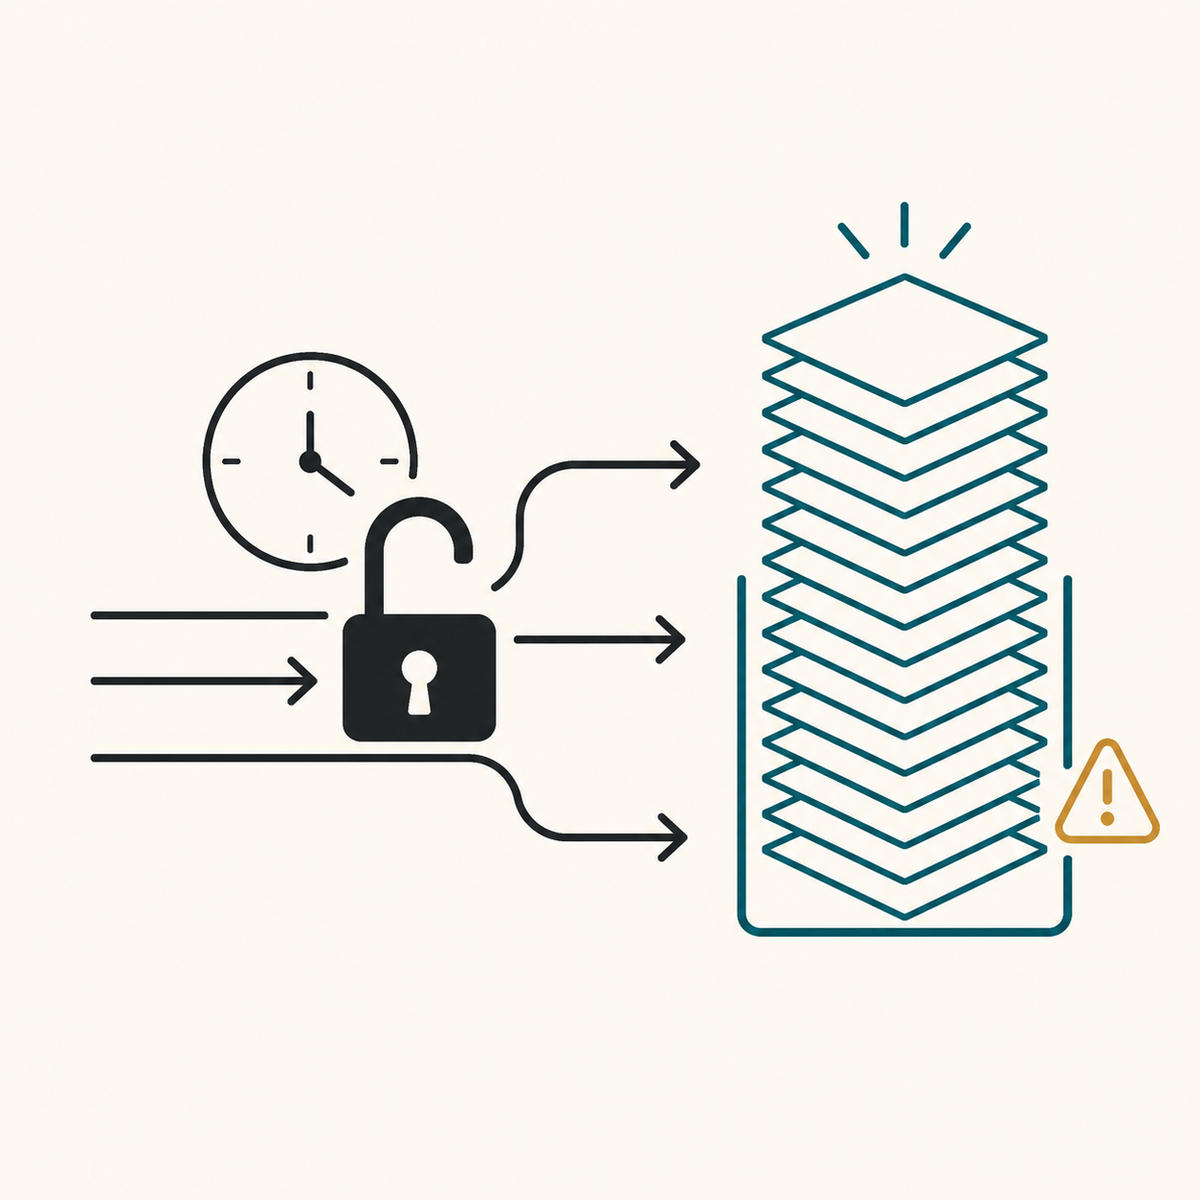
Usually it blocks nothing at all — and that is the problem. One transaction left open for five minutes on Postgres 16, holding nothing but a snapshot from a single-row SELECT, grew a 9.7 MB table to 38.6 MB and its indexes from 2.8 MB to 15.6 MB under an ordinary 1,000-updates-a-second workload. The same workload without it left the table at 10.2 MB. No query waited. Throughput moved by 0.2%. Autovacuum ran five times and removed nothing, because vacuum may not remove a row version the oldest snapshot in the system might still need to see.
The locks everyone worries about are real, but they are the visible failure. They page you. Bloat does not.
The short answer
- One idle transaction held for five minutes made the table 4.0x larger (9.66 MB → 38.62 MB) under 300,000 updates, against 1.05x (9.66 MB → 10.16 MB) for the identical workload with nothing open.
- It blocked no queries. Throughput was 998.7 updates/sec with it and 996.9 without. Unthrottled it cost 7.7% — 13,692 vs 14,830 updates/sec — while making the table 5.6x bigger.
- A read-only
idle in transactionsession at READ COMMITTED does not hold the vacuum horizon back at all on Postgres 16:backend_xminis null and vacuum removed all 50,000 dead tuples anyway. REPEATABLE READ, an open cursor, or one written row anywhere all do hold it. - Plain
VACUUMafterwards took 0.41 s and returned zero bytes to the filesystem. It removed all 1,643,031 dead tuples; the table stayed at 168 MB.VACUUM FULLtook it back to 9,888 kB, under ACCESS EXCLUSIVE. statement_timeoutandidle_in_transaction_session_timeouteach catch exactly the case the other misses, and a transaction of many short statements slips past both. Postgres 16 has notransaction_timeout; that is 17.
What was measured, and on what
Apple M3, 8 cores, 16 GB RAM, macOS 26.4.1. Postgres 16.15 (aarch64) in Docker 29.5.2, 8 CPUs and 8.3 GB visible to the Docker VM, shared_buffers=512MB, --shm-size=1g, autovacuum left at its defaults. Load generated by pgbench inside the container over the Unix socket.
These are indicative figures from a laptop, not a tuned server benchmark. Absolute sizes will differ on your hardware. The ratios are the finding.
The table is 100,000 rows of (id, balance, updated_at, note) with a primary key and a btree on updated_at. The workload is one statement:
UPDATE ledger SET balance = balance + 1, updated_at = now() WHERE id = :id;
updated_at is indexed, so every update writes a new index entry — no HOT updates, which is the common case in real schemas. Each run starts from VACUUM FULL, so both arms begin byte-identical.
Why does the table grow?
Postgres never overwrites a row. An UPDATE writes a new version and leaves the old one as a dead tuple. Vacuum reclaims dead tuples, but only those no open snapshot could still need. One snapshot from five minutes ago means nothing newer than five minutes ago is removable — including 300,000 row versions no transaction will ever read.
The mechanism is visible in two places. First, pg_stat_activity:
SELECT pid, state, backend_xmin,
       date_trunc('second', now() - xact_start) AS xact_age
  FROM pg_stat_activity WHERE backend_xmin IS NOT NULL;
 pid |        state        | backend_xmin | xact_age
-----+---------------------+--------------+----------
 154 | idle in transaction |        90932 | 00:01:32
 185 | active              |       181082 | 00:00:00
backend_xmin is the whole story. Pid 154 needs to see everything from transaction 90,932 onward, so nothing from 90,932 onward can be removed — and the active session beside it is 90,150 transactions further along. Second, VACUUM VERBOSE says so out loud (from the five-minute run above):
tuples: 0 removed, 399595 remain, 299595 are dead but not yet removable
removable cutoff: 386770, which was 299600 XIDs old when operation ended
If you are searching for dead row versions cannot be removed yet, oldest xmin: — that wording is gone; Postgres 13 rewrote the message. On 16 you want are dead but not yet removable and the line beginning removable cutoff:. The 299600 XIDs old is the size of the problem in one number.
How much does it cost, exactly?
Five minutes, 1,000 updates/sec, 100,000-row table, autovacuum at defaults. Identical seed, identical workload; the only difference is one open transaction.
| After 5 min of ~300,000 updates | No long transaction | One idle transaction |
|---|---|---|
| Table size at start | 9.66 MB | 9.66 MB |
| Table size at end | 10.16 MB | 38.62 MB |
| Index size at start | 2.84 MB | 2.84 MB |
| Index size at end | 9.23 MB | 15.65 MB |
| Dead tuples at end | 49,764 | 300,096 |
| Autovacuum runs | 4 | 5 |
| Dead tuples they removed | most of them | none |
| Updates completed | 299,068 | 299,595 |
| Throughput | 996.9/sec | 998.7/sec |
Five autovacuum cycles ran on the bloated table. All five scanned, wrote WAL and freed nothing, because the cutoff never moved. In every dashboard, autovacuum achieving nothing looks exactly like autovacuum working.
The heap diverged immediately: 15.5 MB after one minute, 20.5 MB after two, 24.7 MB after three. The indexes are the more uncomfortable result — they grew in both arms, from 2.84 MB to 9.23 MB even with no long transaction, because a btree on a monotonically increasing timestamp keeps appending on the right and vacuum makes pages reusable rather than returning them. The long transaction made that worse, not different.
Push the rate up and the gap widens. Two minutes unthrottled, four clients:
| Unthrottled, 120 s | No long transaction | One idle transaction |
|---|---|---|
| Updates completed | 1,779,603 | 1,643,031 |
| Throughput | 14,830/sec | 13,692/sec |
| Table size | 30 MB | 168 MB |
| Index size | 35 MB | 53 MB |
| Dead tuples | 370,413 | 1,650,943 |
Normalised for the 8% fewer updates: roughly 11 MB of table growth per million updates without it, 96 MB per million with it. The control arm is not flat either — at 14,800 updates a second default autovacuum falls behind on its own, the same ceiling the queue benchmark ran into.
Does it block writes?
No, and this was the measurement that surprised us most. We expected a visible throughput cost from the growing heap. Over two minutes we got 7.7%; over the rate-limited five minutes, nothing measurable at all. The reason is that 168 MB still fits in shared_buffers. Bloat is not a throughput problem until the working set stops fitting in RAM, and then it stops being gradual.
That is the trap. The metric that would warn you — queries per second — stays flat right up to the point where it does not. The metric that tells the truth is pg_table_size over time, and almost nobody graphs it. A sequential count over the 168 MB table took 17.6–18.6 ms against 6.8–7.0 ms on the same 100,000 rows compacted, on a table small enough to be entirely cached. Once it has outgrown RAM, that 2.6x is read from disk.
Does an idle transaction always hold the horizon?
No. This is the sharpest thing we measured, and it contradicts the usual advice.
One holder session per flavour, 50,000 dead tuples generated, then VACUUM VERBOSE on a 50,000-row table with autovacuum disabled.
Open transaction, sitting idle in transaction |
backend_xid |
backend_xmin |
Dead tuples vacuum removed |
|---|---|---|---|
| (none — control) | – | – | 50,000 |
READ COMMITTED, ran one SELECT |
null | null | 50,000 |
REPEATABLE READ, ran one SELECT |
null | 754 | 0 |
| READ COMMITTED, wrote one row in another table | 761 | null | 0 |
| READ COMMITTED, holds an open cursor | null | 764 | 0 |
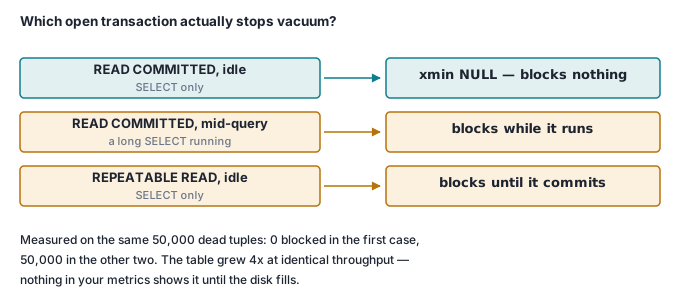
A READ COMMITTED transaction releases its snapshot at the end of each statement. If it has not written anything it has no transaction id either, so it is invisible to the vacuum horizon however long it sits there. Change one thing — raise the isolation level, leave a cursor open, write a single row anywhere in the database — and it pins the horizon for the whole cluster.
Which is why "we saw idle in transaction, that must be it" is a bad diagnosis. Sort by backend_xmin, not by state. The session doing the damage may not be the oldest one on screen.
Is a busy long transaction any better?
Not for bloat. We repeated the five-minute run with a REPEATABLE READ transaction that spent 280 of those seconds looping over real aggregate scans instead of sitting idle:
| Five minutes, ~300,000 updates | Idle transaction | Busy transaction |
|---|---|---|
| Table size at end | 38.62 MB | 38.71 MB |
| Index size at end | 15.65 MB | 15.65 MB |
| Dead tuples at end | 300,096 | 300,645 |
| Aggregate scans completed inside it | 0 | 64,852 |
Byte for byte the same damage. The difference is what you bought with it: 64,852 scans of useful work, or nothing. That is the whole argument for idle_in_transaction_session_timeout — not that idle transactions are more harmful than busy ones, but that they are equally harmful and return zero value, so killing them is free. Killing a busy one costs you the report it was computing.
Does it block DDL, the thing everyone expects?
Yes, and this part deserves its reputation. An open transaction holds its table locks until it commits, including the ACCESS SHARE lock a plain SELECT takes. ALTER TABLE wants ACCESS EXCLUSIVE, so it queues. And because lock requests are ordered, everything arriving after the queued DDL queues behind it too — including ordinary reads that were perfectly compatible with the long reader.
We opened a READ COMMITTED reader (which, per the table above, does nothing to vacuum), started an ALTER TABLE ... ADD COLUMN, and two seconds later fired three ordinary statements:
 pid |        state        | wait_event_type | wait_event | query
-----+---------------------+-----------------+------------+------------------------------------
 259 | idle in transaction | Client          | ClientRead | SELECT count(*) FROM ledger;
 273 | active              | Lock            | relation   | ALTER TABLE ledger ADD COLUMN memo
 292 | active              | Lock            | relation   | SELECT count(*) FROM ledger;
 294 | active              | Lock            | relation   | SELECT balance FROM ledger WHERE id
 293 | active              | Lock            | relation   | UPDATE ledger SET balance=balance

 pid |        mode         | granted
-----+---------------------+---------
 259 | AccessShareLock     | t
 273 | AccessExclusiveLock | f
 292 | AccessShareLock     | f
 293 | RowExclusiveLock    | f
 294 | AccessShareLock     | f
One granted lock, four waiting. We released the reader after 22 seconds:
| Statement | With the reader open, no DDL | With the DDL queued in front |
|---|---|---|
ALTER TABLE ... ADD COLUMN |
milliseconds | 20,072 ms |
SELECT count(*) |
98–207 ms | 18,074 ms |
Indexed single-row SELECT |
— | 18,054 ms |
Single-row UPDATE |
— | 18,056 ms |
Those 98–207 ms baselines are mostly docker exec and psql startup; the query itself is around 7 ms. Every statement finished within 20 ms of the moment the long reader let go. A migration that "takes a second" took the table offline for as long as one forgotten SELECT stayed open — and the outage was the queue behind the DDL, not the DDL. Set lock_timeout on migration sessions so it gives up rather than standing in the doorway.
Can you just vacuum it away afterwards?
You can remove the dead tuples. You cannot get the disk back.
On the 168 MB table with 1,643,031 dead tuples, once the long transaction was closed:
| Step | Wall time | Table | Indexes | Dead tuples |
|---|---|---|---|---|
| Before | — | 168 MB | 53 MB | 1,643,031 |
VACUUM ledger |
0.41 s | 168 MB | 53 MB | 0 |
VACUUM FULL ledger |
0.16 s | 9,888 kB | 4,416 kB | 0 |
Plain VACUUM was fast, complete, and freed nothing on disk. It marks the space reusable by that table — useful if the table is about to grow into it again, useless if you needed the volume back. VACUUM FULL rewrites the table and rebuilds the indexes under an ACCESS EXCLUSIVE lock, which per the previous section means every query on that table waits for it. It was 0.16 s here only because 94% of the table was dead space and just 100,000 live rows had to be copied; on a large mostly-live table it is a maintenance window, and pg_repack exists for that reason.
The recovery time was never the problem. The space not coming back is.
Which timeout actually stops it?
Two settings, each covering exactly what the other does not. Measured on Postgres 16 with a REPEATABLE READ transaction:
| Transaction sits idle | Transaction is busy | |
|---|---|---|
statement_timeout = 2s |
survives — still open, backend_xmin held, at 10 s |
killed at 2 s: canceling statement due to statement timeout |
idle_in_transaction_session_timeout = 5s |
killed: FATAL: terminating connection due to idle-in-transaction timeout |
survives — still active and holding at 12 s |
A third case beats both. A transaction that runs a short query, pauses a second, runs another, and repeats never idles long enough for one nor runs long enough for the other: ours was still open with its original backend_xmin after ten seconds. Postgres 17 added transaction_timeout for exactly this; on 16 you need a reaper that scans pg_stat_activity for old xact_start and calls pg_terminate_backend.
Set both anyway, at the role level so no application forgets:
ALTER ROLE app SET idle_in_transaction_session_timeout = '30s';
ALTER ROLE app SET statement_timeout = '60s';
ALTER ROLE migrations SET lock_timeout = '3s';
Thirty seconds is aggressive on purpose. An application that needs a transaction open for longer is usually holding it open across a network call, which is the bug — the same shape as the pool exhaustion in how many Postgres connections is too many.
The distinction that makes this hard to test
Getting the measurement right took three attempts, and the failures are worth naming because they are the same reasons this behaviour is widely misunderstood.
A session running a long query is not the same as one idle in transaction. Repeating the probe with the holder sitting inside pg_sleep(12) — so its state is active, not idle in transaction — gives the opposite result:
| Holder state | Isolation | backend_xmin | Dead tuples blocked |
|---|---|---|---|
active (mid-query) |
READ COMMITTED | 732 | 50,000 |
idle in transaction |
READ COMMITTED | NULL | 0 |
idle in transaction |
REPEATABLE READ | 733 | 50,000 |
READ COMMITTED takes a fresh snapshot per statement, so it holds one while a statement runs and releases it the moment that statement finishes. A long SELECT blocks vacuum for exactly as long as it runs. The same session, idle between statements, blocks nothing.
And the dead tuples must be created after the holder's snapshot. Update the rows first and they are older than the snapshot, so they are removable no matter what the holder is doing — a test built that way reports "no problem" for every configuration and quietly proves nothing.
Check it yourself
Three minutes, one container. Two identical 90-second runs; the only difference in the second is one transaction that reads one row and then does nothing.
docker run --rm -d --name cite-txn-demo --shm-size=1g \
  -e POSTGRES_PASSWORD=demo -p 55612:5432 postgres:16 -c shared_buffers=512MB
until docker exec cite-txn-demo pg_isready -U postgres >/dev/null 2>&1; do sleep 1; done

docker exec cite-txn-demo psql -U postgres -q \
 -c "CREATE TABLE ledger (id bigint PRIMARY KEY, balance bigint NOT NULL,
       updated_at timestamptz NOT NULL DEFAULT now(), note text NOT NULL);" \
 -c "CREATE INDEX ledger_updated_idx ON ledger (updated_at);"

docker exec cite-txn-demo bash -c "cat > /tmp/upd.sql <<'SQL'
\set id random(1, 100000)
UPDATE ledger SET balance = balance + 1, updated_at = now() WHERE id = :id;
SQL"
Helpers. reseed compacts first, so both runs start byte-identical:
reseed () {
  docker exec cite-txn-demo psql -U postgres -q \
   -c "TRUNCATE ledger;" \
   -c "INSERT INTO ledger SELECT g,1000,now(),repeat('x',40) FROM generate_series(1,100000) g;" \
   -c "VACUUM (FULL, ANALYZE) ledger;"
}
sizes () {
  docker exec cite-txn-demo psql -U postgres -tAF' | ' -c \
    "SELECT pg_size_pretty(pg_table_size('ledger')), pg_size_pretty(pg_indexes_size('ledger')),
            n_dead_tup FROM pg_stat_user_tables WHERE relname='ledger';"
}
load () { docker exec cite-txn-demo pgbench -U postgres -n -f /tmp/upd.sql \
            -c 4 -j 4 -T 90 -R 1000 postgres 2>&1 | grep -E '^tps'; }
Run A — nothing else connected. Ours: 10 MB | 4872 kB | 31925 at 1,002 updates/sec.
reseed; echo "start: $(sizes)"; load; echo "end: $(sizes)"
Run B — identical, plus one idle transaction. The FIFO keeps a psql session genuinely idle; pg_sleep would show up as active instead. Ours: 18 MB | 7072 kB | 90258 at 1,002 updates/sec.
reseed; echo "start: $(sizes)"
fifo=/tmp/holder.fifo; rm -f $fifo; mkfifo $fifo
docker exec -i cite-txn-demo psql -U postgres -X -q < $fifo >/dev/null 2>&1 &
exec 9>$fifo
printf 'BEGIN ISOLATION LEVEL REPEATABLE READ;\nSELECT balance FROM ledger WHERE id = 1;\n' >&9
sleep 2
load; echo "end:   $(sizes)"
Now watch vacuum refuse. With the holder open, ours reported 0 removed, 190148 remain, 90148 are dead but not yet removable; two seconds after closing it, 90148 removed, 100000 remain.
docker exec cite-txn-demo psql -U postgres -c \
  "SELECT pid, state, backend_xmin, date_trunc('second', now()-xact_start) AS xact_age
     FROM pg_stat_activity WHERE backend_xmin IS NOT NULL;"
docker exec cite-txn-demo psql -U postgres -c "VACUUM (VERBOSE) ledger;" 2>&1 | grep -E "tuples:|removable cutoff"

exec 9>&-; sleep 2
docker exec cite-txn-demo psql -U postgres -c "VACUUM (VERBOSE) ledger;" 2>&1 | grep -E "tuples:|removable cutoff"
echo "after plain VACUUM: $(sizes)"
docker exec cite-txn-demo psql -U postgres -q -c "VACUUM FULL ledger;"
echo "after VACUUM FULL:  $(sizes)"

docker rm -f cite-txn-demo
Ours ended 18 MB | 7072 kB | 0 after the plain VACUUM — every dead tuple gone, not one byte returned — and 9888 kB | 3800 kB | 0 after VACUUM FULL. Those two lines are the article. If your absolute sizes differ, the number that matters is run B's end size against run A's.
Where this goes next
Every step of a user-defined flow in Workflow Builder is a claimed job in Postgres, and a step that waits on a third-party HTTP call is exactly the shape that holds a transaction open across a network round trip. The fix was structural — commit before the call goes out — with idle_in_transaction_session_timeout as the backstop.
Elsewhere in this series: how many jobs a second a Postgres queue really handles and where your database actually lives — which matters here, because the 168 MB sits on a real volume and nothing returns it on its own.