What does each extra index actually cost you?
Measured on Postgres 16 at one million rows: every extra btree index costs 76 bytes of WAL per row written and about 1.5 microseconds per inserted row. One index halved insert throughput; eight left 8 percent of it. But on two of the four write paths the extra indexes cost exactly nothing.
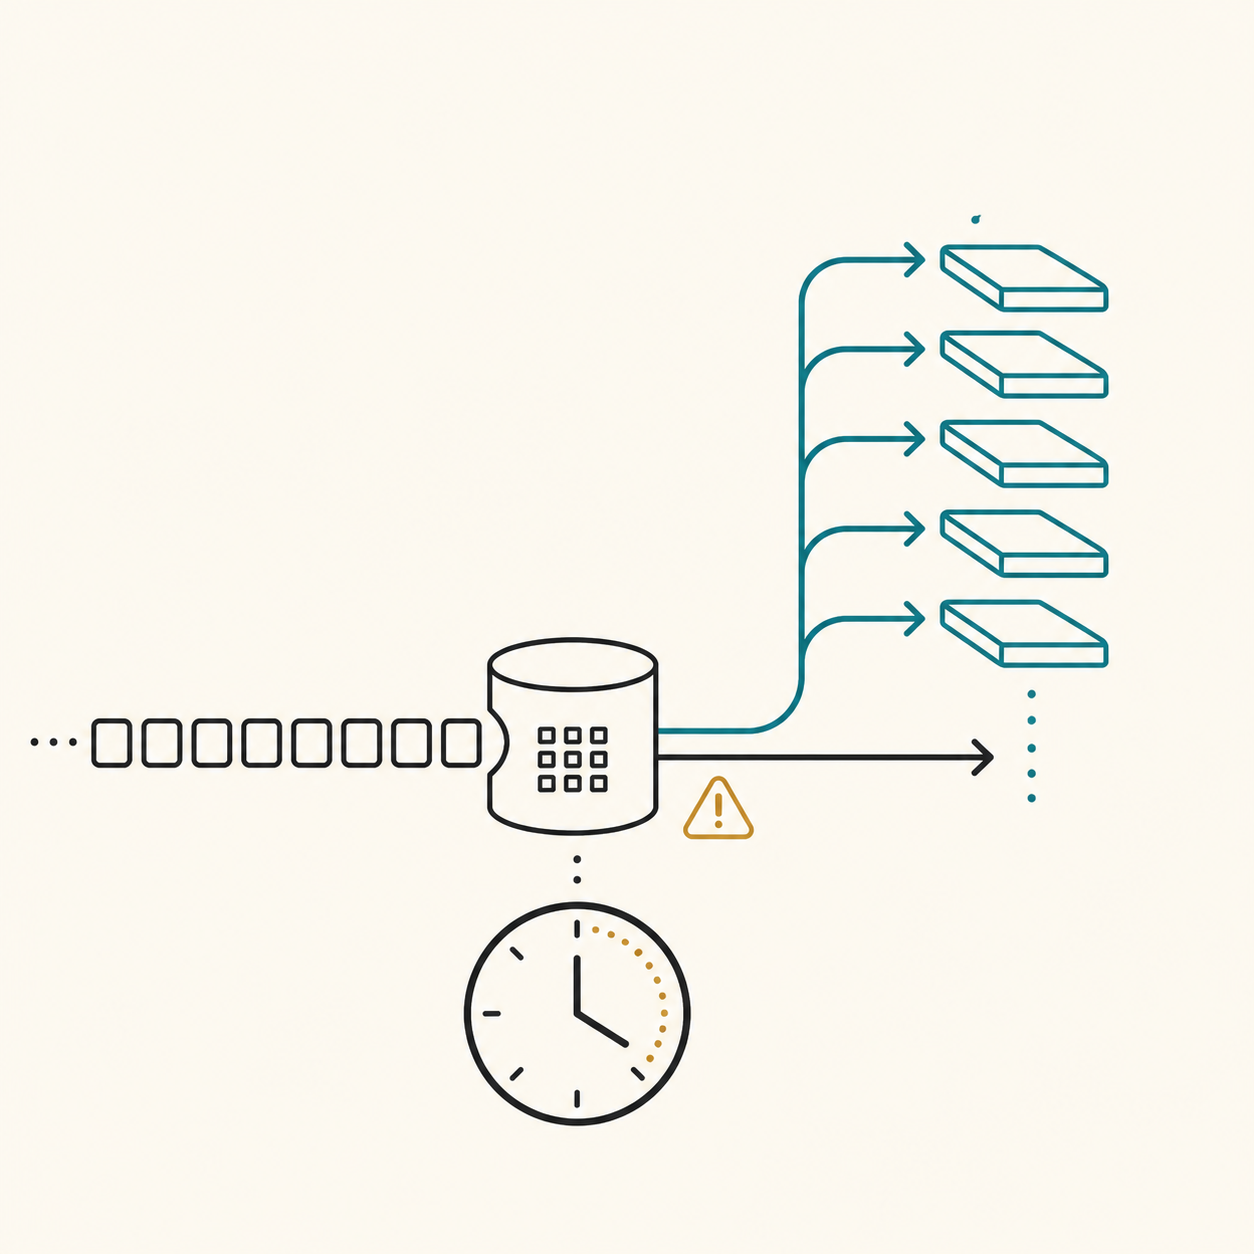
Each extra btree index cost 76 bytes of WAL per row written and about 1.5 µs per inserted row — enough that one index halved insert throughput on a one-million-row Postgres 16 table, from 754,000 rows a second to 378,000, and eight indexes left 8% of it. That is the part everyone expects. The part nobody publishes is that on two of the four write paths, extra indexes cost nothing at all — byte for byte, at zero indexes and at eight.
The short answer
- On Postgres 16 at one million rows, each extra btree index on a random
intcolumn added 76 bytes of WAL per inserted row — 75.9, 76.5, 76.3 and 76.2 bytes at 1, 2, 4 and 8 indexes, stable to 1% across eight runs and two separate containers. - The same 76 bytes reappear on an UPDATE that cannot take the HOT path, because a non-HOT update inserts a fresh entry into every index on the table — including the seven whose columns the UPDATE never mentioned.
- When HOT is available, extra indexes are free on UPDATE. Updating an unindexed column at
fillfactor=25cost 80.2 bytes of WAL per row at 100% HOT with zero indexes, and 80.2 bytes at 100% HOT with eight. Byte-identical, on every run. - DELETE is index-count-independent: 56.2 bytes of WAL per row at 0, 1, 2, 4 and 8 indexes, because a delete only stamps the heap tuple. The bill arrives at VACUUM, where cleaning 300,000 dead rows cost an extra 13.1 MB of WAL and roughly 40 ms per index.
- The cost per index is a fixed amount of time, not a fixed percentage. Each index added ~1.5 µs to a 1.33 µs baseline, so the first index is the expensive one: it costs half the insert throughput, while going from seven indexes to eight costs 11% of what is left.
What was measured, and on what
Postgres 16.15 (aarch64) in Docker 29.5.2 on an Apple M3 laptop: 8 cores, 16 GB RAM, macOS 26.4.1, shared_buffers=512MB, --shm-size=1g, wal_level=replica, synchronous_commit=on, wal_compression=off. These are indicative figures from a laptop in Docker, not a tuned server benchmark. What transfers is the per-index increment, which reproduced to within a percent.
One table, one million rows, about 135 MB of heap:
CREATE TABLE t (id bigint PRIMARY KEY,
                k1 int, k2 int, k3 int, k4 int, k5 int, k6 int, k7 int, k8 int,
                hot_col int, payload text);
k1 through k8 hold uniformly random values in 1..1,000,000, so a btree on each is the realistic bad case: every insert lands on a different leaf page. hot_col and payload are never indexed.
On measuring WAL honestly. Every figure is a pg_current_wal_lsn() delta, not pg_stat_wal, which lags. Full-page images are the trap: the first write to a page after a checkpoint logs the whole page, which at eight indexes can be most of the window. So each measurement runs CHECKPOINT, then an identical warm-up statement to absorb the images, then the measured statement — with pg_walinspect's pg_get_wal_stats() confirming fpi_size. Quoted windows were FPI-free or under 0.5% FPI unless stated.
How much does each index slow down an INSERT?
Bulk-loading the million rows with the indexes already in place, eight runs per index count, median and full spread:
| Secondary indexes | Median rows/sec | Range | µs per row | Added per index | Share of no-index rate |
|---|---|---|---|---|---|
| 0 | 753,702 | 548k – 1,035k | 1.33 | — | 100% |
| 1 | 378,144 | 305k – 454k | 2.64 | 1.32 µs | 50.2% |
| 2 | 227,660 | 145k – 288k | 4.39 | 1.53 µs | 30.2% |
| 4 | 134,240 | 67k – 158k | 7.45 | 1.53 µs | 17.8% |
| 8 | 62,751 | 45k – 76k | 15.94 | 1.83 µs | 8.3% |
The throughput column is noisy — this is a laptop, and I would not defend any single value to better than 30%. The µs per row column is not, and it is the one that matters: each index adds a roughly constant 1.3 to 1.8 µs per row.
That constant is why "indexes cost X% of your writes" is the wrong shape of rule. Against a 1.33 µs baseline the first index roughly doubles an insert; the eighth adds 13% to what seven already cost. If you are agonising over a ninth index, you are agonising over the cheapest one you will ever add.
How much extra WAL does each index generate?
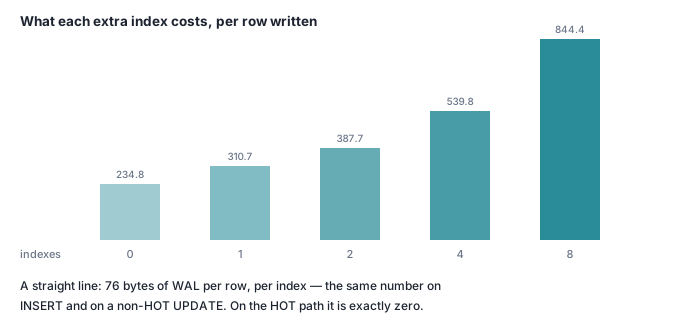
This is where the measurement stops being noisy and starts being an equation.
| Secondary indexes | WAL per inserted row | Delta per index |
|---|---|---|
| 0 | 234.8 B | — |
| 1 | 310.7 B | 75.9 B |
| 2 | 387.7 B | 76.5 B |
| 4 | 539.8 B | 76.3 B |
| 8 | 844.4 B | 76.2 B |
Eight runs each; the largest deviation across all forty was 0.03%. A four-byte key, a six-byte heap pointer, btree tuple headers and the WAL record framing come to 76 bytes on the wire per index per row. Multiply that by your write rate when sizing replication bandwidth or WAL archive storage: eight indexes on a table taking 5,000 inserts a second is an extra 3 MB/sec of WAL, forever.
Does an index on a column the UPDATE never touches still cost anything?
Yes — but only when HOT is unavailable, and then it costs full price.
A heap-only tuple update writes the new row version onto the same page as the old one and leaves every index alone. Postgres takes that path when no indexed column changed and there is room on the page. Break either condition and the new version needs an entry in every index, related to your change or not.
Same table, same 1M rows, UPDATE t SET hot_col = hot_col + 1 WHERE id <= 100000 — a column in no index at all. The only variable is fillfactor, which decides whether there is room on the page:
| Indexes | ff=25, WAL/row | ff=25, HOT | ff=100, WAL/row | ff=100, HOT | ff=100 rows/sec |
|---|---|---|---|---|---|
| 0 | 80.2 / 82.5 / 82.5 B | 100,000/100,000 | 315.2 B | 0/100,000 | 371,733 |
| 1 | 80.2 / 82.5 / 82.5 B | 100,000/100,000 | 392.3 B | 0/100,000 | 140,999 |
| 2 | 80.2 / 82.5 / 82.5 B | 100,000/100,000 | 468.7 B | 0/100,000 | 85,115 |
| 4 | 80.2 / 82.5 / 82.5 B | 100,000/100,000 | 622.6 B | 0/100,000 | 47,644 |
| 8 | 80.2 / 82.5 / 82.5 B | 100,000/100,000 | 930.9 B | 0/100,000 | 24,406 |
Three runs per cell; the ff=100 WAL column is the median and includes under 0.5% full-page images. The left half is the result I did not expect to be this clean. Eight indexes, and the update path is byte-identical to a table with none: 8,023,5xx bytes of WAL for 100,000 rows on the first round and 8,252,8xx on the two after it, at every index count without exception. On the HOT path an index you never touch is not cheap. It is free.
The right half is the same statement at the default fillfactor=100, where a freshly loaded page has no room for a second row version. HOT drops to zero and the per-index cost reappears at exactly the insert-path rate: 76.6, 76.3, 76.4 and 76.5 bytes per index per row once full-page images are subtracted. The statement also runs 15x slower at eight indexes than at none, because each row now costs 4.5 µs per index instead of nothing.
So the honest form of the folklore is not "indexes slow down updates". It is an index you never touch costs 76 bytes and 4.5 µs on every update the moment HOT stops working — and on a default-fillfactor table just after loading, HOT is already not working.
Those 930.9 bytes are the steady state. Run the same statement as the first thing after a checkpoint and it cost 2,436.8 bytes per row, 65% of it full-page images — a production cost as well as a measurement hazard.
Where does HOT come back? Sweeping fillfactor at eight indexes, same update:
| fillfactor | HOT updates | Heap size | Rows/sec (3 runs) |
|---|---|---|---|
| 100 | 0 / 100,000 | 148 MB | 48,130 – 53,090 |
| 90 | 11,542 / 100,000 | 164 MB | 64,014 – 70,866 |
| 70 | 45,000 / 100,000 | 206 MB | 96,978 – 116,142 |
| 50 | 100,000 / 100,000 | 269 MB | 1,243,812 – 1,326,348 |
| 25 | 100,000 / 100,000 | 558 MB | 886,682 – 1,095,482 |
The HOT counts were identical to the row across all three runs — 11,542 at fillfactor=90, three times out of three. The cliff between 70 and 50 is a 12x throughput step bought with 30% more disk. On a table whose hot columns are unindexed and updated often, free space on the page is what makes the indexes free.
What does updating an indexed column cost?
Everything the fillfactor bought you. Same table at fillfactor=25 — plenty of room — but the update now changes k1, which one index covers:
| Indexes | Column updated | WAL per row | HOT | Rows/sec (median) |
|---|---|---|---|---|
| 8 | hot_col, unindexed |
80.2 B | 100,000/100,000 | 1,158,816 |
| 1 | k1, indexed |
213.4 B | 0/100,000 | 216,758 |
| 2 | k1, indexed |
294.7 B | 0/100,000 | 62,444 |
| 4 | k1, indexed |
457.5 B | 0/100,000 | 48,893 |
| 8 | k1, indexed |
783.1 B | 0/100,000 | 22,003 |
Changing one indexed column disqualifies the row from HOT, and then all eight indexes must be updated — including the seven that have never heard of k1. The increment is 81.3 bytes per index per row, and the statement costs 9.8x the WAL and 50x the time of the identical update against an unindexed column on the same table. (Those are settled values; the first update after a fresh CREATE INDEX ran ~90 B/row higher at every count, because a newly built btree is packed to 90% and the new entries split pages. The increment held either way.)
This is the mechanism that makes a single index on a jsonb column so expensive: there, any edit to the document counts as changing the indexed column.
How much disk do the indexes take?
At one million rows, with the indexes built by CREATE INDEX after loading:
| Secondary indexes | Heap | All indexes | Total | Index : heap |
|---|---|---|---|---|
| 0 | 135 MB | 21 MB | 156 MB | 0.16 |
| 1 | 135 MB | 40 MB | 175 MB | 0.30 |
| 2 | 135 MB | 59 MB | 194 MB | 0.44 |
| 4 | 135 MB | 97 MB | 231 MB | 0.72 |
| 8 | 135 MB | 172 MB | 307 MB | 1.28 |
Eight indexes on four-byte integers occupy more space than the table they index. Each btree is 18.9 MB for a column holding 4 MB of data: a key, a six-byte pointer, headers, roughly 10% slack. Grown by insert rather than built, they come to 191 MB instead of 151 MB, 26% larger. Bulk-loading a table? Load first, index after.
Are DELETEs slower with more indexes?
No, and this one is exact. DELETE FROM t WHERE id BETWEEN ... for 100,000 rows, with full_page_writes off so the windows are unambiguous:
| Secondary indexes | WAL for 100,000 deletes | Per row |
|---|---|---|
| 0 | 5,616,568 B | 56.2 B |
| 1 | 5,616,504 B | 56.2 B |
| 2 | 5,616,520 B | 56.2 B |
| 4 | 5,616,504 B | 56.2 B |
| 8 | 5,616,504 B | 56.2 B |
Three runs each; the total spread across all fifteen was 104 bytes on 5.6 MB. A DELETE stamps xmax on the heap tuple and stops. It never touches the indexes, so all eight entries are still there, still pointing at a dead row.
What does VACUUM cost per index?
That is where the deferred bill lands. After deleting 300,000 of the million rows:
| Secondary indexes | VACUUM time (median of 3) | WAL written | Full-page images |
|---|---|---|---|
| 0 | 36 ms | 9.4 MB | 4,274 |
| 1 | 142 ms | 22.5 MB | 6,672 |
| 2 | 148 ms | 35.6 MB | 9,068 |
| 4 | 252 ms | 61.9 MB | 13,863 |
| 8 | 373 ms | 114.3 MB | 23,451 |
Perfectly linear: 13.12 MB of WAL and 2,397 full-page images per index at every index count, to remove 300,000 dead entries. Each index is only 2,409 pages in total, so vacuuming 30% of the table rewrites 99.5% of every secondary index — randomly scattered dead entries reach essentially every leaf page.
Turn full-page writes off and the same vacuum writes 1.20 MB per index instead of 13.12 MB. The logical work is 4 bytes per dead entry; the other 40 are the cost of dirtying a page untouched since the last checkpoint. On a high-churn table most of your vacuum WAL is not the vacuum, it is the checkpoint interaction — the effect that makes autovacuum the first thing to break under sustained queue load.
Does it matter whether the indexed values arrive in order?
More than the index count does. Same eight indexes, same million rows; the only change is whether the indexed values are random or monotonically increasing:
| Indexed values | Rows/sec (3 runs) | WAL per row | Index size |
|---|---|---|---|
| Random | 71,889 / 73,754 / 70,509 | 844.4 B | 212 MB |
| Sequential | 231,389 / 185,406 / 245,850 | 765.2 B | 193 MB |
3.2x the insert throughput for the same eight indexes (WAL excludes full-page images). A sequential key appends to the rightmost leaf; a random key dirties a different page every time. So "eight indexes" is not one number — one more reason the primary key type matters.
So what is the rule?
For a narrow btree on Postgres 16, per extra index:
- 76 bytes of WAL per row inserted, and per row updated when HOT is unavailable. Reproducible to 1%; multiply by your write rate for the replication and archive bill.
- About 1.5 µs per inserted row and 4.5 µs per non-HOT updated row — roughly
1 / (1 + 1.15n)of the no-index insert rate at n indexes: 50% at one, 18% at four, 8% at eight. - Roughly 19 MB per million rows on disk for a 4-byte key, 24 MB if grown by random insert rather than built.
- 13 MB of WAL and ~40 ms per 300,000 dead rows at vacuum time.
- Zero on updates that stay HOT, and zero on deletes. Both exactly zero.
The consequence is not "have fewer indexes". It is that an index's write cost is dominated by whether your updates stay on the HOT path, decided by two things you control: never index a column your hot UPDATE statements change, and leave room on the page for the new row version. Get those right and the eighth index costs almost nothing on update. Get them wrong and the index you added for one report sits on the critical path of every write — so read the plan first.
Check it yourself
One container, ninety seconds, nothing installed. It loads a million rows at 0, 1, 2, 4 and 8 indexes, measures insert throughput and WAL per row at each, then runs the same update three ways: no room on the page, room, and against an indexed column.
docker run --rm -d --name cite-idx-demo --shm-size=1g \
  -e POSTGRES_PASSWORD=demo -e POSTGRES_DB=bench -p 55608:5432 \
  postgres:16 -c shared_buffers=512MB -c max_wal_size=4GB -c checkpoint_timeout=30min
until docker exec cite-idx-demo pg_isready -U postgres >/dev/null 2>&1; do sleep 1; done

docker exec cite-idx-demo psql -U postgres -d bench -q \
 -c "CREATE EXTENSION pg_walinspect;" \
 -c "CREATE TABLE src AS SELECT g AS id,
       (random()*1000000)::int k1,(random()*1000000)::int k2,(random()*1000000)::int k3,
       (random()*1000000)::int k4,(random()*1000000)::int k5,(random()*1000000)::int k6,
       (random()*1000000)::int k7,(random()*1000000)::int k8,
       0 AS hot_col, md5(g::text)||md5((g+1)::text) AS payload
     FROM generate_series(1,1000000) g;" \
 -c "VACUUM ANALYZE src;"
The measurement itself. The warm-up UPDATE before the measured one exists only to absorb full-page images, so the WAL delta is the real cost and not the checkpoint's.
run() {   # run <n indexes> <fillfactor> <column to update>
  local N=$1 FF=$2 COL=$3 IDX="" i=1
  while [ $i -le $N ]; do IDX="$IDX CREATE INDEX ix$i ON t (k$i);"; i=$((i+1)); done
  docker exec cite-idx-demo psql -U postgres -d bench -q \
    -c "DROP TABLE IF EXISTS t;" \
    -c "CREATE TABLE t (id bigint PRIMARY KEY, k1 int,k2 int,k3 int,k4 int,
                        k5 int,k6 int,k7 int,k8 int, hot_col int, payload text)
        WITH (fillfactor=$FF, autovacuum_enabled=off);" \
    -c "$IDX" -c "CHECKPOINT;"
  docker exec -i cite-idx-demo psql -U postgres -d bench -tAq <<SQL
SELECT pg_current_wal_lsn() l0, clock_timestamp() t0 \gset
INSERT INTO t SELECT * FROM src;
SELECT clock_timestamp() t1, pg_current_wal_lsn() l1 \gset
SELECT rpad('n=$N ff=$FF',12) || ' INSERT '
  || lpad(round(1000000/extract(epoch from (:'t1'::timestamptz-:'t0'::timestamptz)))::text,8) || ' rows/s '
  || lpad(round(pg_wal_lsn_diff(:'l1',:'l0')/1000000.0,1)::text,7) || ' B WAL/row  fpi='
  || (SELECT coalesce(sum(fpi_size),0) FROM pg_get_wal_stats(:'l0',:'l1'));
SQL
  docker exec cite-idx-demo psql -U postgres -d bench -q -c "VACUUM ANALYZE t;" -c "CHECKPOINT;"
  docker exec cite-idx-demo psql -U postgres -d bench -q \
    -c "UPDATE t SET $COL = $COL + 1 WHERE id <= 100000;"   # warm-up: absorbs full-page images
  docker exec -i cite-idx-demo psql -U postgres -d bench -tAq <<SQL
SELECT pg_current_wal_lsn() l0, clock_timestamp() t0 \gset
BEGIN;
UPDATE t SET $COL = $COL + 1 WHERE id <= 100000;
SELECT pg_stat_get_xact_tuples_hot_updated('t'::regclass) hot \gset
COMMIT;
SELECT clock_timestamp() t1, pg_current_wal_lsn() l1 \gset
SELECT rpad('n=$N ff=$FF',12) || ' UPDATE $COL '
  || lpad(round(100000/extract(epoch from (:'t1'::timestamptz-:'t0'::timestamptz)))::text,8) || ' rows/s '
  || lpad(round(pg_wal_lsn_diff(:'l1',:'l0')/100000.0,1)::text,7) || ' B WAL/row  HOT '
  || lpad(:'hot',6) || '/100000  idx=' || pg_size_pretty(pg_indexes_size('t'))
  || ' fpi=' || (SELECT coalesce(sum(fpi_size),0) FROM pg_get_wal_stats(:'l0',:'l1'));
SQL
}

for n in 0 1 2 4 8; do run $n 100 hot_col; done   # no room on the page: no HOT
for n in 0 8;       do run $n  25 hot_col; done   # room on the page: all HOT
for n in 1 8;       do run $n  25 k1;      done   # HOT killed by an indexed column

docker rm -f cite-idx-demo
A run of exactly that on the machine described above printed:
--- default fillfactor: no room on the page, so no HOT updates ---
n=0 ff=100   INSERT  1103042 rows/s   234.8 B WAL/row  fpi=14376
n=0 ff=100   UPDATE hot_col   380575 rows/s   315.2 B WAL/row  HOT      0/100000  idx=24 MB fpi=0
n=1 ff=100   INSERT   534868 rows/s   311.2 B WAL/row  fpi=0
n=1 ff=100   UPDATE hot_col   181026 rows/s   388.7 B WAL/row  HOT      0/100000  idx=51 MB fpi=0
n=2 ff=100   INSERT   303880 rows/s   387.4 B WAL/row  fpi=0
n=2 ff=100   UPDATE hot_col   122091 rows/s   461.3 B WAL/row  HOT      0/100000  idx=78 MB fpi=5072
n=4 ff=100   INSERT   167175 rows/s   539.7 B WAL/row  fpi=0
n=4 ff=100   UPDATE hot_col    73860 rows/s   608.4 B WAL/row  HOT      0/100000  idx=133 MB fpi=5072
n=8 ff=100   INSERT    80441 rows/s   844.8 B WAL/row  fpi=0
n=8 ff=100   UPDATE hot_col    37423 rows/s   902.4 B WAL/row  HOT      0/100000  idx=242 MB fpi=5072
--- fillfactor 25: HOT updates possible, same eight indexes ---
n=0 ff=25    INSERT   666679 rows/s   234.8 B WAL/row  fpi=0
n=0 ff=25    UPDATE hot_col  1293946 rows/s    80.2 B WAL/row  HOT 100000/100000  idx=21 MB fpi=0
n=8 ff=25    INSERT    70697 rows/s   845.1 B WAL/row  fpi=149968
n=8 ff=25    UPDATE hot_col  1115934 rows/s    80.2 B WAL/row  HOT 100000/100000  idx=213 MB fpi=0
--- fillfactor 25, but the UPDATE changes an indexed column ---
n=1 ff=25    INSERT   337278 rows/s   311.2 B WAL/row  fpi=0
n=1 ff=25    UPDATE k1   283010 rows/s   229.5 B WAL/row  HOT      0/100000  idx=54 MB fpi=0
n=8 ff=25    INSERT    76939 rows/s   844.8 B WAL/row  fpi=0
n=8 ff=25    UPDATE k1    41667 rows/s   742.4 B WAL/row  HOT      0/100000  idx=238 MB fpi=0
The three blocks are the whole article. In the first, WAL per row climbs by a flat 76 bytes per index on the insert line and 73 on the update line, and HOT is zero throughout. In the second, HOT is 100,000 out of 100,000 and the update line reads 80.2 bytes per row at eight indexes and 80.2 at none, while the insert line still shows all eight at 845 bytes. In the third, the only change is which column the UPDATE names — and the same eight indexes go from free to 742 bytes a row.
Index sizes here are larger than the table above (242 MB against 172 MB) because the script creates the indexes before loading rather than after.
Where this goes next
The tables behind Workflow Builder carry a status column that every run updates and a set of reporting indexes that never touch it. These measurements are why the status column is not in any of them.