SQLite or Postgres for a small app?
SQLite in WAL mode committed 21,066 single-row inserts per second from one process, 3.7x what Postgres 16 managed on the same laptop. The second concurrent writer halved it and multiplied the worst commit from 1.1 ms to 237 ms. That tail, not throughput, is the ceiling.

One writer, and about 20,000 commits a second: SQLite in WAL mode committed 21,066 single-row inserts per second from one process, 3.7x what Postgres 16 managed on the same laptop — but the second concurrent writer halved that to 9,771/sec and multiplied the worst commit from 1.1 ms to 237 ms. The ceiling is not throughput. It is the tail.
Two pieces of folklore fight over this. "SQLite is a toy, use a real database" is wrong by 3.7x on writes and 20x on reads. "SQLite is all you need" is wrong as soon as a second process writes — and wrong in a way no throughput graph shows, only the 99.9th percentile, and only in production.
The short answer
- SQLite is right up to one writer process. At one writer it beat Postgres 16 on every write and on point-lookup reads. At two writers its throughput halved; Postgres 16 went from 5,619 to 9,803 rows/sec over the same step.
- What breaks past one writer is worst-case latency, not throughput. With 8 writers, SQLite's slowest commit was 1,702 ms and Postgres 16's was 11.2 ms — 152x apart, while their throughputs stayed within a factor of 2.1.
busy_timeoutdoes not fix concurrent writes; it converts errors into waiting. In WAL mode withbusy_timeout=0and 4 writers, 90.4% of inserts failed with SQLITE_BUSY. Withbusy_timeout=5000, 100% committed and the slowest took 525.7 ms. Same queue, different place to look for it.- WAL mode is not optional if anything reads while anything writes. In rollback-journal mode, one writer made 70.4% of concurrent reads fail and dragged its own rate down to 154 rows/sec. In WAL mode: 0.0% reader failures and 10,059 rows/sec.
- A SQLite handle costs 0.055 ms to open; a Postgres connection costs 3.773 ms — 69x. For anything that connects per request, that gap is the whole argument.
What was measured, and on what
Apple M3, 16 GB, macOS 26.4.1, under normal desktop load. SQLite 3.53.4 through Python 3.14.6's sqlite3 module, in-process. PostgreSQL 16.15 (aarch64, Debian build) in Docker 29.5.2 with --cpus=4 --memory=4g --shm-size=1g, shared_buffers=1GB, reached over a mapped TCP port from the host with psycopg 3.3.4.
Same schema both sides — id primary key, a float, a short text tag and a 96-byte payload — same rows, same machine, same Python process driving both. Every figure is a median of at least three runs, with the spread printed wherever it matters. These are indicative of one laptop, and the Postgres side pays for a TCP hop through Docker's port forwarder that a native install would not. The ratios travel; the absolute numbers do not.
One caveat changes the numbers more than the hardware does, so it belongs here rather than in a footnote: this was measured on macOS, where SQLite's default fsync() is not a device-level flush. On Linux it is. There is a section below with that measurement.
Which writes faster, SQLite or Postgres?
Two workloads: one INSERT per transaction, which is what a request handler does, and 1,000 INSERTs per transaction, which is what an import does. Both at synchronous=FULL.
| Workload | SQLite rollback journal | SQLite WAL | Postgres 16 |
|---|---|---|---|
| 5,000 rows, one per transaction | 5,355/s | 10,603/s | 6,773/s |
| spread over 7 runs | 4,202 – 5,781 | 5,161 – 19,138 | 6,540 – 6,799 |
| 200,000 rows, 1,000 per transaction | 1,044,148/s | 1,143,979/s | 142,781/s |
| spread over 5 runs | 1.02M – 1.05M | 1.13M – 1.15M | 135,754 – 145,426 |
| database size for 200,000 rows | 24.90 MB | 24.90 MB | 34.89 MB |
SQLite wins the batched insert by 8x and stores the same 200,000 rows in 71% of the space — 124.5 bytes per row against 174.5. But the 8x is an artefact of comparing the wrong things. Postgres has a bulk path, and it closes almost the whole gap: COPY ... FROM STDIN loaded the same rows at 898,062 rows/sec (874,410 – 944,382) against SQLite's 1,143,979. If you are bulk-loading Postgres with INSERT statements, the problem is the statements.
Note the spread on the SQLite WAL row: 5,161 to 19,138 rows/sec across seven runs of an identical workload. Measured three separate ways, single-writer WAL commit rate on this machine produced medians of 6,075, 10,603 and 21,066 rows/sec, with individual runs anywhere from 3,384 to 23,693. It is bimodal rather than noisy around a mean, so every comparison below is drawn from within one harness rather than across them.
How many writers can SQLite handle?
This is the question the rest of it hangs on. Each writer is a separate OS process with its own connection, doing 2,000 inserts, one per transaction, into one database. SQLite is in WAL mode with busy_timeout=5000, which is the configuration everyone recommends. Seven runs each.
| Writers | SQLite WAL rows/s | SQLite worst commit | Postgres rows/s | Postgres worst commit |
|---|---|---|---|---|
| 1 | 21,066 | 1.1 ms | 5,619 | 5.7 ms |
| 2 | 9,771 | 237.0 ms | 9,803 | 5.7 ms |
| 4 | 10,234 | 525.7 ms | 12,946 | 8.3 ms |
| 8 | 8,173 | 1,702.5 ms | 17,239 | 11.2 ms |
The throughput columns cross at two writers and never come back. The latency columns are not close at any point past one. Postgres's worst commit doubled across the sweep; SQLite's went up 1,548x.
SQLite's throughput column is visibly noisy — at 4 writers the seven runs ranged from 6,845 to 27,502 rows/sec, and an earlier pass put the 8-writer median above the 4-writer one. Do not trust it to two significant figures. The tail column is monotonic, tightly spread (940.6 – 1,828.3 ms at 8 writers), and is the one that decides whether an HTTP request times out.
Does WAL mode fix concurrent writes, or just hide them?
It hides them, and the hiding is the useful part — as long as you know where it put the problem. Same sweep, busy_timeout set to 0 and to 5,000 ms:
| Journal | busy_timeout | Writers | Committed | SQLITE_BUSY | p50 | Worst commit |
|---|---|---|---|---|---|---|
| rollback | 0 | 4 | 488 / 8,000 | 93.9% | 0.22 ms | 1.7 ms |
| rollback | 5000 | 4 | 8,000 / 8,000 | 0.0% | 0.18 ms | 1,396.1 ms |
| WAL | 0 | 4 | 771 / 8,000 | 90.4% | 0.07 ms | 3.6 ms |
| WAL | 5000 | 4 | 8,000 / 8,000 | 0.0% | 0.03 ms | 940.0 ms |
| WAL | 0 | 8 | 561 / 16,000 | 96.5% | 0.10 ms | 5.4 ms |
| WAL | 5000 | 8 | 16,000 / 16,000 | 0.0% | 0.03 ms | 955.5 ms |
Without a busy timeout, four writers lose 90% of their inserts to SQLITE_BUSY and every surviving commit is fast. With a busy timeout, nothing is lost and the median commit gets faster — 0.03 ms, because the contended writers are asleep and out of the way — while the unlucky ones wait a second.
That is the whole mechanism, and it is worth being blunt about. SQLite's busy handler is a sleep-and-retry loop, not a queue: no fairness, no wakeup when the lock frees, no ordering. A writer that loses the race sleeps for a progressively longer interval and tries again. Your p50 looks excellent. Your p99.9 is a coin flip, and past busy_timeout it turns back into an error under load — exactly when you least want a new failure mode.
Postgres has no such shape because its writers do not exclude each other: they take row locks, and its worst commit at 8 concurrent writers was 11.2 ms.
Can readers read while SQLite is writing?
In WAL mode, yes, completely. In the default rollback-journal mode, no — and this is the single most consequential default in SQLite. Four reader processes with busy_timeout=0 (so failures are visible rather than absorbed), five seconds, 50,000 rows:
| Journal mode | Reads/sec | Reads failing with SQLITE_BUSY | Writer rows/sec |
|---|---|---|---|
| rollback, no writer | 337,238 | 0.0% | — |
| rollback, 1 writer running | 134,777 | 70.4% | 154 |
| WAL, no writer | 906,852 | 0.0% | — |
| WAL, 1 writer running | 690,996 | 0.0% | 10,059 |
Seventy percent of reads failed, and the writer managed 154 rows/sec — in rollback-journal mode readers block the writer as hard as the writer blocks readers, and four busy readers nearly starve it. One pragma turned 154 rows/sec into 10,059 and 70.4% reader failures into none.
PRAGMA journal_mode=WAL;   -- persists in the file; set it once
PRAGMA busy_timeout=5000;  -- per connection; set it on every one
If you take one line from this article, that is the one. It is also why the offline FTS5 search index in an earlier article is usable while the app is updating content underneath it.
How fast are reads, and what does a connection cost?
200,000 rows, 20,000 random primary-key lookups per reader process:
| Readers | SQLite WAL | SQLite rollback | Postgres 16 |
|---|---|---|---|
| 1 | 182,911/s | 133,453/s | 9,170/s |
| 2 | 337,006/s | 217,197/s | 17,039/s |
| 4 | 519,303/s | 283,069/s | 24,036/s |
| 8 | 333,610/s | 124,341/s | 30,297/s |
| full-scan aggregate | 8.3 ms | 8.3 ms | 5.1 ms |
SQLite reads 20x faster on point lookups, and it is not because SQLite is a better B-tree. It is because there is no round trip: a lookup on an open handle took 0.004 ms against 0.122 ms through the socket. Readers scale to 4 processes and fall off at 8 on a machine whose cores are already busy running them.
Then the result that went the other way. Postgres won the full-table aggregate, 5.1 ms against 8.3 ms, on a table it stores in 40% more space. One count(*), avg(ts) over 200,000 rows is enough for a planner with parallel sequential scans to beat a single-threaded walk through the SQLite pager. The in-process advantage is per statement; it buys nothing on work measured in milliseconds of CPU.
Connection cost, 200 repetitions of the same one-row lookup:
| Operation | Median | Min | p99 |
|---|---|---|---|
| SQLite: open file, query, close | 0.055 ms | 0.054 ms | 0.097 ms |
| SQLite: query on an open handle | 0.004 ms | 0.004 ms | 0.005 ms |
| Postgres: connect, query, close | 3.773 ms | 3.539 ms | 6.172 ms |
| Postgres: query on an open connection | 0.122 ms | 0.097 ms | 0.285 ms |
Opening a SQLite file is 69x cheaper than opening a Postgres connection, which is why serverless and CLI workloads like it so much. It is also why Postgres needs a pool and SQLite does not — a subject with its own measurements.
Why would these numbers be different on Linux?
Because fsync() means something different. On macOS, fsync() returns once the data reaches the drive's cache; forcing a real platter-level flush needs F_FULLFSYNC, which SQLite exposes as PRAGMA fullfsync and leaves off by default. On Linux, fsync() is the real flush. So the durability you get from identical SQLite settings is not identical across the two.
Cost of asking macOS for the real thing, one insert per transaction:
| Journal | synchronous | fullfsync | Rows/sec | Spread |
|---|---|---|---|---|
| rollback | FULL | off (default) | 5,675 | 4,278 – 5,838 |
| rollback | NORMAL | off | 5,110 | 4,451 – 6,060 |
| rollback | OFF | off | 8,892 | 6,244 – 9,430 |
| rollback | FULL | on | 99 | 92 – 102 |
| WAL | FULL | off (default) | 6,075 | 3,384 – 22,397 |
| WAL | NORMAL | off | 125,010 | 123,547 – 129,679 |
| WAL | OFF | off | 165,315 | 164,564 – 168,270 |
| WAL | FULL | on | 301 | 295 – 305 |
Asking macOS for the real flush costs 57x in rollback-journal mode and 20x in WAL. No Linux box was measured here, so take no ratio between the two platforms from this article — but a write figure obtained without a device-level flush is an upper bound, and every SQLite write number above is one.
Two smaller things fall out of the same table. In WAL mode synchronous=NORMAL — the pairing everyone recommends — is 20.6x faster than FULL, because it stops fsyncing the WAL on every commit; it survives a process crash, not a power cut. And in rollback-journal mode NORMAL buys nothing measurable: 5,110 against 5,675, with overlapping spreads.
So which one?
Use SQLite when writes come from one process. A single-process web app, a desktop or mobile app, a CLI, a build cache, an analytics sink with one ingest worker, anything behind a queue that serialises writes. Turn on WAL, set busy_timeout on every connection, and you have roughly 20,000 single-row commits a second and half a million reads a second with no server to run.
Move to Postgres when a second process needs to write — which usually arrives as a second app instance, a background worker, or a cron job, not as a traffic increase. The trigger is not a request rate. It is a deployment shape. On this machine the crossover was two concurrent writers for throughput, and one for tail latency.
The middle case — an app that has outgrown one machine only in reads — is not a database problem. A SQLite read replica is a file copy, so shipping it inside the image is a legitimate deployment.
A second run, and what stayed true
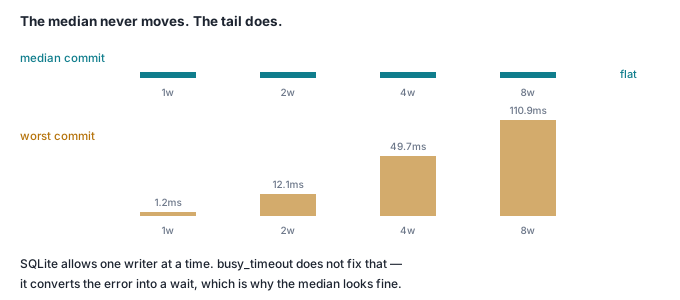
Re-running the concurrency arm on the same machine with a different harness — synchronous=NORMAL, 1,200 inserts per worker, separate processes — gave different throughput but the same shape:
| Writers | rows/sec | p50 commit | worst commit |
|---|---|---|---|
| 1 | 23,273 | 0.01 ms | 1.2 ms |
| 2 | 37,450 | 0.01 ms | 12.1 ms |
| 4 | 46,136 | 0.01 ms | 49.7 ms |
| 8 | 50,726 | 0.01 ms | 110.9 ms |
Here throughput rose with writer count instead of halving. The median commit never moved. The worst commit got 92 times worse.
Take the disagreement seriously: SQLite's aggregate write throughput under contention is sensitive enough to the harness that two honest measurements on one laptop point in opposite directions. What did not vary is the thing that actually decides whether you can ship it — the tail. Every configuration, in both runs, held a flat median while the worst case grew with each writer added.
That is the number to design against. An average request time of a millisecond is no comfort when one user in a thousand waits a second and a half.
Check it yourself
One file, standard library only, no server. It runs the sweep that matters: journal mode × busy_timeout × writer count, printing the BUSY rate and the worst commit for each.
#!/usr/bin/env python3
"""Find your own SQLite write ceiling. Stdlib only: python3 sqlitewall.py"""
import multiprocessing as mp, os, sqlite3, statistics, time

DB, M, PAY = "wall.db", 1000, "x" * 96          # 1000 inserts per writer

def worker(w, mode, timeout_ms, start_at, q):
    db = sqlite3.connect(DB, isolation_level=None, timeout=30.0)
    db.execute("PRAGMA synchronous=FULL")
    db.execute(f"PRAGMA busy_timeout={timeout_ms}")
    lat, busy = [], 0
    time.sleep(max(0.0, start_at - time.time()))
    t0 = time.perf_counter()
    for i in range(M):
        a = time.perf_counter()
        try:
            db.execute("INSERT INTO events VALUES (?,?,?,?)", (w * 10**6 + i, a, "click", PAY))
            lat.append((time.perf_counter() - a) * 1000)
        except sqlite3.OperationalError as e:
            if "locked" in str(e) or "busy" in str(e): busy += 1
            else: raise
    q.put((time.perf_counter() - t0, lat, busy))
    db.close()

def trial(mode, nw, timeout_ms):
    for suf in ("", "-wal", "-shm", "-journal"):
        try: os.remove(DB + suf)
        except FileNotFoundError: pass
    db = sqlite3.connect(DB, isolation_level=None)
    print_mode = db.execute(f"PRAGMA journal_mode={mode}").fetchone()[0]
    db.execute("CREATE TABLE events(id INTEGER PRIMARY KEY, ts REAL, kind TEXT, payload TEXT)")
    db.close()
    q, start_at = mp.Queue(), time.time() + 0.4
    ps = [mp.Process(target=worker, args=(w, mode, timeout_ms, start_at, q)) for w in range(nw)]
    for p in ps: p.start()
    res = [q.get() for _ in ps]
    for p in ps: p.join()
    wall = max(r[0] for r in res)
    lat = sorted(x for r in res for x in r[1])
    busy = sum(r[2] for r in res)
    return (print_mode, len(lat) / wall, 100 * busy / (nw * M),
            statistics.median(lat), lat[int(len(lat) * .99)], lat[-1])

if __name__ == "__main__":
    print(f"sqlite {sqlite3.sqlite_version} | {M} inserts per writer, one per transaction\n")
    print(f"{'journal':<8} {'busy_timeout':>13} {'writers':>8} {'rows/s':>9} "
          f"{'BUSY':>7} {'p50 ms':>8} {'p99 ms':>8} {'max ms':>9}")
    for mode in ("DELETE", "WAL"):
        for to in (0, 5000):
            for nw in (1, 2, 4, 8):
                m, tps, busy, p50, p99, pmax = trial(mode, nw, to)
                print(f"{m:<8} {to:>13} {nw:>8} {tps:>9,.0f} {busy:>6.1f}% "
                      f"{p50:>8.2f} {p99:>8.2f} {pmax:>9.1f}")
    for suf in ("", "-wal", "-shm", "-journal"):
        try: os.remove(DB + suf)
        except FileNotFoundError: pass
python3 sqlitewall.py
On the M3 laptop above, that prints:
sqlite 3.53.4 | 1000 inserts per writer, one per transaction

journal   busy_timeout  writers    rows/s    BUSY   p50 ms   p99 ms    max ms
delete               0        1     4,555    0.0%     0.19     1.08       2.7
delete               0        2     4,121   71.3%     0.19     0.48       2.3
delete               0        4     3,239   93.7%     0.22     0.62       2.5
delete               0        8     2,822   96.9%     0.19     1.39       2.8
delete            5000        1     4,883    0.0%     0.18     0.50       1.6
delete            5000        2     4,918    0.0%     0.17     0.48     230.8
delete            5000        4     4,270    0.0%     0.18     0.28     745.0
delete            5000        8     4,792    0.0%     0.18     0.32    1487.6
wal                  0        1    13,144    0.0%     0.06     0.30       1.7
wal                  0        2     5,974   93.5%     0.12     0.81       1.9
wal                  0        4     6,495   94.2%     0.10     1.26       1.8
wal                  0        8     7,451   95.5%     0.09     0.39       8.8
wal               5000        1    13,358    0.0%     0.06     0.31       1.9
wal               5000        2    19,090    0.0%     0.04     0.17      78.2
wal               5000        4    20,336    0.0%     0.03     0.17     165.3
wal               5000        8     5,819    0.0%     0.03     0.14    1007.6
Read the last two columns and ignore the throughput one; on this run the throughput column is non-monotonic in both directions and the max ms column is not. Then find your own crossover: raise the writer count until max ms passes the timeout your callers actually enforce. That number, not a rows/sec figure, is where your app leaves SQLite.