What happens when you forget to set a timeout?
Node 23's fetch waits 301 seconds for a response and http.request waits forever — measured. Long before that, a slow vendor took a healthy database endpoint from 100% to 7.7% success, while the endpoint that touched nothing stayed at 100%.
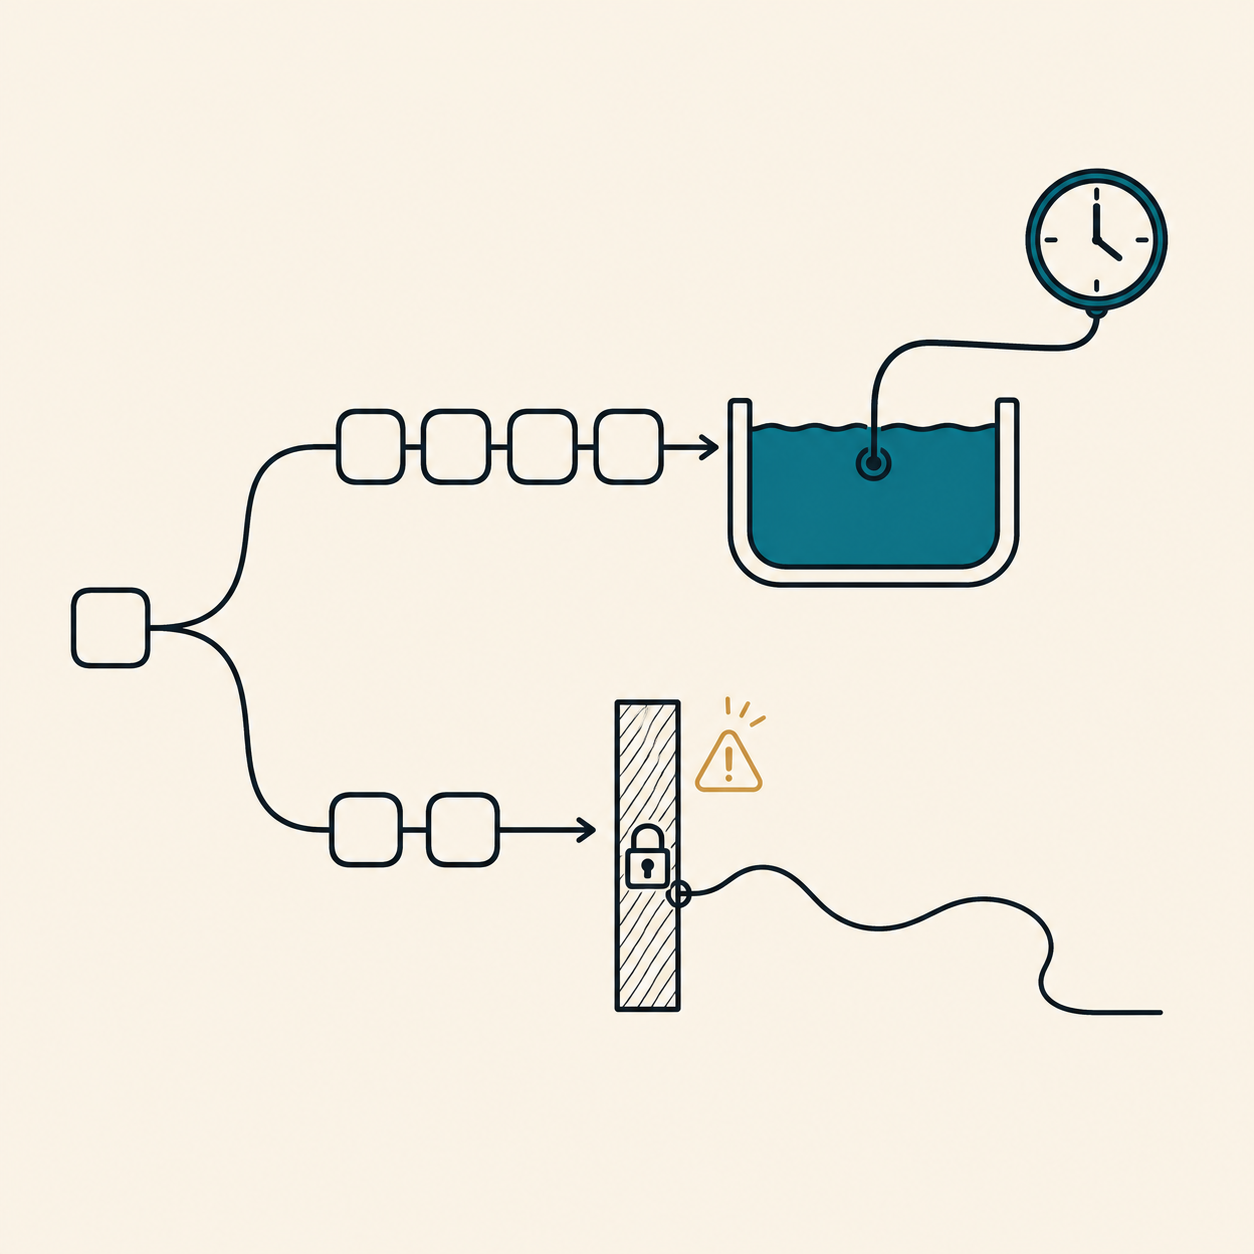
On Node v23.5.0, fetch waited 301,109 ms — five minutes — before it gave up on a dependency that accepted the connection and never answered, and http.request never gave up at all: it was still waiting 6,325 seconds later, with no error. That is the default. Nobody chooses it, and almost nobody notices, because a healthy vendor hides it.
The interesting part is not the number. It is what those five minutes do to the rest of your service. In the runs below, a dependency that slowed from 300 ms to 5 s took an unrelated database endpoint from a 100% success rate to 7.7%, while the vendor itself never returned a single error. The pager says your app is broken. It is not; it is full.
Everything here was measured on an Apple M3 (8 cores, 16 GB, macOS 26.4.1), Node v23.5.0, Postgres 16.15 in Docker 29.5.2, pg 8.23.0. Only Postgres is containerised.
The short answer
- Node 23 has no default response timeout worth the name.
fetchthrewHeadersTimeoutErrorafter 301,109 ms (undici's 300 sheadersTimeout). A barehttp.requestwith notimeoutoption waited 1,029,076 ms in one run and 6,325 s and counting in another — it only ever ended when we killed the server. - The connect timeout is not the response timeout.
fetchto an unroutable address failed in 10,552 ms withUND_ERR_CONNECT_TIMEOUT. That 10 s default fools people into thinkingfetchis protected. It covers the TCP handshake only. - The endpoint that dies is not the one calling the vendor. With the dependency at 5 s,
GET /db— a bareSELECT 1that never touches the vendor — succeeded 1 time out of 13.GET /healthy, which does no I/O at all, stayed at 148/148, 100%, at every latency we tried. - The pool empties faster than you can observe it. Our first sample, 29 ms after load started, already showed 0 idle Postgres connections and 21 requests queued. The error the caller sees is
timeout exceeded when trying to connect, after 2,001 ms — a Postgres error, from a Postgres outage that never happened. - A bulkhead beat a timeout in the one case that matters. Against a vendor that hung forever with no timeout set at all, limiting the dependency to 5 concurrent calls kept
/dbat 99/99, 100%. The best timeout we tried (250 ms) also reached 100%, but sent the struggling vendor 790 requests where the no-timeout run sent 40.
Does fetch have a default timeout in Node 23?
Only for connecting. We built a dependency with a /hang route that accepts the request, records it, and never responds — no error, no close, just silence — and pointed three clients at it.
$ node defaults.js
2026-08-31T09:10:48.373Z fetch blackhole threw after 10552 ms :: TypeError ::
  fetch failed :: cause= ConnectTimeoutError UND_ERR_CONNECT_TIMEOUT
  (attempted address: 192.0.2.1:80, timeout: 10000ms)
2026-08-31T09:15:38.892Z fetch /hang  threw after 301109 ms :: TypeError ::
  fetch failed :: cause= HeadersTimeoutError UND_ERR_HEADERS_TIMEOUT
2026-08-31T09:27:46.895Z http.request /hang errored after 1029076 ms ::
  ECONNRESET :: socket hang up
Three different behaviours from one hung server. The blackhole address never completed a handshake, so undici's 10 s connect timeout fired. /hang did complete it, leaving only the 300 s headers timeout — 301,109 ms measured. And http.request, which has no default timeout of any kind, waited 1,029,076 ms and stopped only because we killed the dependency; ECONNRESET is the server dying, not a timeout. A second run confirmed it: still waiting, destroyed=false, at 6,325 seconds.
If your process is meant to restart cleanly, that matters twice over — a request stuck for five minutes is a request your shutdown drain has to wait for or abandon.
Why did my healthy endpoint start failing?
Here is the result we did not expect, stated plainly: it did not. Not the truly healthy one.
Our service has three routes. /healthy returns a string and touches nothing. /db runs SELECT 1 through a pg pool of 10. /work takes a pool connection, then calls the vendor while holding it — the ordinary shape of "load the record, enrich it from the API, save it". We drove 50 concurrent requests at /work for 30 seconds and probed the other two every 200 ms.
| Vendor latency | /work p50 |
/work success |
/healthy success |
/db success |
/db p50 |
|---|---|---|---|---|---|
| 50 ms | 279 ms | 5338/5338 — 100% | 148/148 — 100% | 68/68 — 100% | 241 ms |
| 200 ms | 1,036 ms | 1440/1440 — 100% | 146/146 — 100% | 27/27 — 100% | 839 ms |
| 300 ms | 1,544 ms | 970/970 — 100% | 147/147 — 100% | 19/19 — 100% | 1,339 ms |
| 500 ms | 2,039 ms | 580/720 — 80.6% | 148/148 — 100% | 13/14 — 92.9% | 1,835 ms |
| 1,000 ms | 2,026 ms | 290/710 — 40.8% | 148/148 — 100% | 13/14 — 92.9% | 1,818 ms |
| 2,000 ms | 2,029 ms | 140/677 — 20.7% | 147/147 — 100% | 11/14 — 78.6% | 1,810 ms |
| 5,000 ms | 7,001 ms | 50/583 — 8.6% | 148/148 — 100% | 1/13 — 7.7% | 1,776 ms |
| never answers | — | 0/560 — 0% | 148/148 — 100% | 0/13 — 0% | — |
/healthy is a flat 100% down the whole column. Node did not run out of workers, because Node has no workers — a pending fetch costs an event-loop callback and a socket, and the file-descriptor limit on this host is 1,048,576. The popular mental model, where a slow call "ties up a thread", is a Java and Rails model. It does not transfer.
What does transfer is every bounded resource the slow path holds. Here that is the Postgres pool, and the damage lands on /db — an endpoint whose code has nothing to do with the vendor. Between a 300 ms vendor and a 500 ms vendor, /db crosses from perfect to failing. By 5 s it is effectively down, and the error is timeout exceeded when trying to connect: a database error, pointing at a database that is completely healthy.
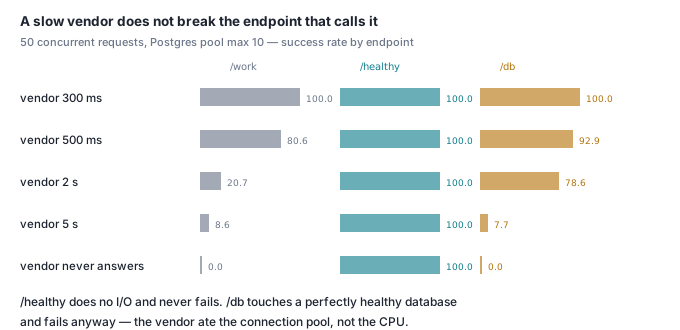
That is the whole cascade. It is not CPU, it is not memory, and it is not the event loop. It is the fixed-size thing behind the slow call.
How fast does the pool actually empty?
Faster than a metrics scrape. We polled the pool while 30 concurrent requests hit a vendor that hangs forever:
t=29ms   {"poolTotal":10,"poolIdle":0,"poolWaiting":21,"depAttempts":0}
t=66ms   {"poolTotal":10,"poolIdle":0,"poolWaiting":21,"depAttempts":10}
t=395ms  {"poolTotal":10,"poolIdle":0,"poolWaiting":21,"depAttempts":10}
The very first sample is already exhausted. And depAttempts sticks at 10 forever — the pool is now the bottleneck, so only 10 requests ever reach the vendor no matter how much traffic arrives.
The process never recovers on its own. Fifteen seconds after we stopped all load, with those 10 requests still parked on the hung vendor:
/healthy    -> ok                                           [200 after 0.000817s]
/db         -> Error: timeout exceeded when trying to connect [503 after 2.001261s]
/work?ms=50 -> Error: timeout exceeded when trying to connect [503 after 2.001726s]
Ten stuck sockets permanently removed a ten-connection pool from service. If you have ever wondered why we argue for small Postgres pools, this is the other half of the argument: a small pool is fast, and it is also a small number of hostages.
What does setting a timeout actually cost?
A timeout that is too aggressive kills requests that would have worked. To price that, we gave the vendor a realistic spread: 90% of calls at 150 ms, 8% at 800 ms, 2% at 6,000 ms. 30 concurrent clients, 20 seconds, AbortSignal.timeout(N).
| Timeout | Requests attempted | Failed | Fail rate | /work p50 |
/work p99 |
|---|---|---|---|---|---|
| none | 636 | 0 | 0% | 737 ms | 6,473 ms |
| 250 ms | 1,214 | 115 | 9.5% | 468 ms | 561 ms |
| 500 ms | 1,069 | 97 | 9.1% | 506 ms | 646 ms |
| 1,000 ms | 890 | 12 | 1.3% | 611 ms | 1,326 ms |
| 2,000 ms | 841 | 16 | 1.9% | 616 ms | 1,293 ms |
| 5,000 ms | 688 | 11 | 1.6% | 702 ms | 1,578 ms |
The 250 ms setting is the trap. It looks great on p99 — 561 ms against 6,473 ms — and it nearly doubled throughput, from 636 requests to 1,214. It also failed 9.5% of requests that would have succeeded, because it cuts through the middle of the distribution. At 1,000 ms, above the 8% band and below the 2% band, the cost drops to 1.3% and p99 is still five times better than no timeout.
The rule the numbers support: set the timeout above the slowest latency band you actually want to serve, not at your p99. If you do not have the vendor's latency distribution, measure it first.
Is a timeout or a bulkhead the better fix?
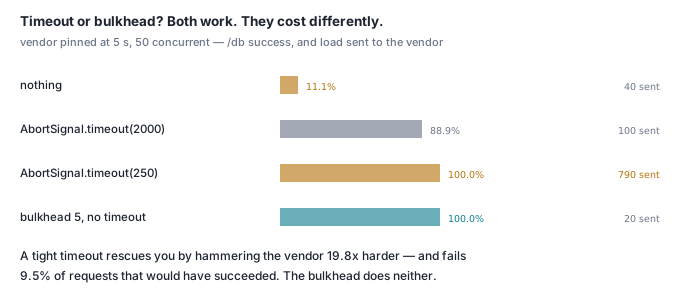
Different jobs. We repeated the outage — vendor pinned at 5 s, 50 concurrent — with each mitigation, and watched /db.
| Mitigation | /work served |
/healthy |
/db success |
Requests the vendor received |
|---|---|---|---|---|
| nothing | 30/380 — 7.9% | 100% | 1/9 — 11.1% | 40 |
AbortSignal.timeout(2000) |
0/386 | 100% | 8/9 — 88.9% | 100 |
AbortSignal.timeout(1000) |
0/418 | 100% | 8/9 — 88.9% | 200 |
AbortSignal.timeout(250) |
0/780 | 100% | 15/15 — 100% | 790 |
| bulkhead: 5 concurrent, no timeout | 15/1,243,552 | 100% | 99/99 — 100% | 20 |
Two honest observations.
First, the timeout works, but not for free, and its effectiveness is exactly proportional to how much extra load it puts on the vendor. The 250 ms setting restored /db to 100% by sending the struggling dependency 790 requests in 20 seconds instead of 40 — 19.8x. Your timeout is somebody else's traffic spike. The vendor's own work does not stop either: after the aborts, our fake vendor still had 200 pending response timers queued for requests nobody was listening to.
Second, the bulkhead protected the pool with no timeout set at all, and it was the only mitigation that held up against a vendor that hangs forever:
=== BULKHEAD 5, queue 0, NO timeout, dependency HANGS FOREVER ===
  load /work?hang=1  n=1216660 ok=0 fail=1216660
  probe /healthy  n=99 ok=99 success=100%
  probe /db       n=99 ok=99 success=100%
  app: {"depAttempts":5,"bulkheadRejected":1216705,"poolTotal":6,"poolIdle":1}
Five requests reached the vendor and stayed there. Everything else was rejected in microseconds — 1.2 million rejections in 30 seconds. /db and /healthy never noticed.
So: the bulkhead is what stops one dependency from consuming a shared resource. The timeout is what stops an individual request from lasting forever. Use both. Only the bulkhead survives the case where the vendor never responds and you forgot the timeout.
One implementation detail decides whether the bulkhead works: the concurrency limit has to be taken before the pool connection, not after. Our first version acquired the Postgres client and then entered the semaphore. It measured identically to no bulkhead at all — 1/9 on /db — because the queued requests were still holding pool connections while they waited.
Does a retry make it better or worse?
Worse — and not by the mechanism people expect. We fixed the vendor at 3,000 ms and the timeout at 1,000 ms, so every attempt times out, then drove a fixed arrival rate of 30 req/s for 10 seconds.
| Attempts per request | Client requests completed | Requests the vendor received | TCP connections opened | Peak concurrent connections |
|---|---|---|---|---|
| 1 | 264 | 293 | 398 | 31 |
| 2 | 235 | 560 | 964 | 61 |
| 3 | 206 | 795 | 1,767 | 91 |
Three attempts sent the vendor 2.7x the requests, 4.4x the TCP connections and 2.9x the peak concurrency — while serving 22% fewer of your own users. A slow dependency is not a failing one, and retrying it is load amplification aimed at something that is already saturated. Our guide to which errors to retry covers the classification; the rule this adds is that a timeout on a slow dependency should back off hard, or not retry at all.
With the database in the path the amplification hides, and the harm changes shape. Under closed-loop load the vendor received exactly 150 requests whether we made 1, 2 or 3 attempts — the pool capped it. What tripled was how long each request held a pool connection: 1 s became 3 s, and /db fell from 85.7% to 28.6%. The retry did not hurt the vendor. It hurt us.
Does the timeout actually free the socket?
Mostly yes, with a caveat worth knowing. We fired 50 concurrent fetch('/hang', { signal: AbortSignal.timeout(1500) }) and counted connections on both sides:
t0                  server open=1    my ESTABLISHED sockets to dep: 1
t+0.7s in flight    server open=51   my ESTABLISHED sockets to dep: 51
outcomes: {"TimeoutError":50}
t+1s after abort    server opened=101 closed=50 aborted=50 open=51   lsof: 51
t+3s                server opened=101 closed=100            open=1   lsof: 1
All 50 sockets really were closed on abort — closed jumps by exactly 50, and the server saw 50 aborted events. But undici immediately opened 50 replacements, so for the next couple of seconds the dependency still had 51 connections from us. Those replacements are idle keep-alive sockets, and undici's 4 s keep-alive reaped them: by the next sample the count was back to 1.
So the abort frees the socket, but a burst of timeouts does not instantly reduce your connection count against the dependency — it churns it. A connection-count graph will not tell you whether your timeout is working; watch aborted on the server side instead.
Check it yourself
Four files, no build step. dep.js is the controllable vendor, app.js the service, load.js the generator, and Postgres runs in a container.
docker run -d --name cite-tmo-pg \
  -e POSTGRES_USER=cst -e POSTGRES_PASSWORD=cst -e POSTGRES_DB=cst \
  -p 55673:5432 postgres:16-alpine

node dep.js &                                              # vendor on 55671
PORT=55674 TIMEOUT_MS=0 node app.js &                      # service, no timeout

# 50 concurrent on the endpoint that calls the vendor, while probing
# two endpoints that do not:
node load.js '{"port":55674,"loadPath":"/work?ms=5000","conc":50,
  "durMs":30000,"probes":[{"path":"/healthy","everyMs":200},
                          {"path":"/db","everyMs":200}]}'
/healthy will report 100%. /db will report about 7.7%, with timeout exceeded when trying to connect. Then restart the service with BULKHEAD=5 BULKHEAD_QUEUE=0 and run exactly the same load: /db returns to 100% with the timeout still switched off.
The one-line version, if you take nothing else: set an explicit timeout on every outbound call, and put a concurrency limit in front of every dependency you do not control. The default is 301 seconds, and your database pool is smaller than that.
Every HTTP step in Workflow Builder ships with both, because the failure above is the one we kept getting called about.
docker rm -f -v cite-tmo-pg