How much is your logging actually costing you?
About 2 microseconds of CPU and 238 bytes of disk per line — and five log lines per request cut a Node 23 server from 68,722 to 46,059 requests per second. Measured: cost per call by log style, the argument-evaluation trap that costs 1,859 ns per disabled debug call, whether stdout blocks the event

A log line costs about 2 microseconds of CPU and 238 bytes of disk, and that is not the expensive part: five log lines per request took a Node 23 server from 68,722 requests per second to 46,059, a 33% loss, while one container writing 200 lines a second fills a 72 GB disk in 17.5 days. The cheap thing is the call. The expensive things are the bytes and the burst.
Hardware: Apple M3, 16 GB, macOS 26.4.1, APFS SSD. Node v23.5.0 arm64 on the host, node:23-alpine (Node v23.11.1) under Docker Engine 29.5.2 in containers. Built-ins only — no logging library — so you can see the mechanism rather than a vendor's benchmark. These are indicative figures from one laptop under normal desktop load, not a lab benchmark. Every number below came out of a command; the commands are at the end.
The short answer
- One
process.stdout.writeof a plain line costs 1,545–1,646 ns when stdout is a file, 703 ns to/dev/null, and 732 ns to a pipe.console.logof an object costs 3,841–4,165 ns, because it runsutil.inspectfirst. - A disabled log call really is free: 0.7–1.6 ns. V8 elides the argument object entirely when the level check fails. But
log.debug(\user ${expensive()}`)` with debug off costs 1,859 ns — 420× the guarded version — because the template is evaluated before the call. - Writing to stdout blocks the event loop in every case that matters. 50,000 lines to a file stalled the loop for 76.8 ms; inside a container with
docker run -t, 106.0 ms. The only non-blocking case buffered 3.9 MB of logs in RAM instead. - Docker's
json-filedriver nearly doubles your log volume: a 79-byte plain line costs 149 bytes on disk, a 144-byte JSON line costs 238. Adding--log-opt max-sizecost no measurable throughput and capped 14.9 MB of log at 2.88 MB. - Sampling 1 in 100 cut the per-event cost from 2,102 ns to 19 ns and the daily volume by 99%. It also throws away 99 of every 100 examples of the rare thing you were trying to find.
What does one log line actually cost?
Ten styles, 200,000 to 2,000,000 iterations each, stdout redirected to a file on the SSD, best of three runs:
| Log style | ns per call | What it does |
|---|---|---|
if (MIN <= DEBUG) guard, level off |
0.8 | one integer compare |
log.debug(msg, obj), level off |
1.4 | call + compare; V8 drops the object |
| build a plain line, no write | 15 | template literal only |
JSON.stringify an 8-field record |
284 | serialise only, no I/O |
stdout.write(plainLine) |
1,618 | 67 bytes to a file |
stdout.write(jsonLine) |
1,999 | serialise + 144 bytes to a file |
console.log(string) |
2,140 | adds format handling and a newline |
console.log(jsonString) |
2,567 | same, on a longer string |
console.log(object) |
3,841 | util.inspect the object first |
Three things fall out of that table.
The write dominates. Serialising an 8-field record to JSON costs 284 ns; getting those bytes to a file costs another 1,300. If you are optimising your logging by trimming fields, you are optimising the small half.
console.log(obj) is the most expensive thing on the list, at 2.4× a raw write, and it produces multi-line human-readable output that no log parser wants. It is a debugging tool that ends up in production because it is what everyone types first.
Destination matters more than style. The same plain write costs 1,618 ns to a file, 703 ns to /dev/null and 732 ns to a pipe. Roughly 900 ns of a file write is the filesystem, not Node.
Is a disabled log call free?
Yes — and that is exactly why the mistake next to it is so easy to miss.
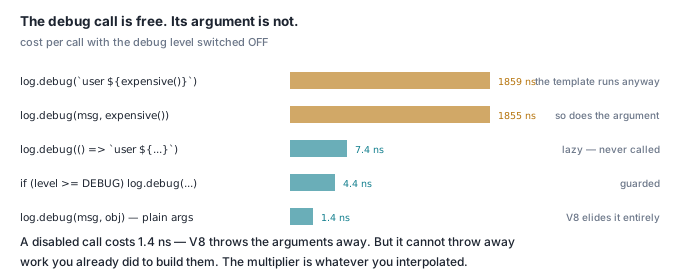
A log.debug(...) whose level is switched off costs 1.4 ns. V8 inlines the call, sees the argument is never used, and removes the allocation. You can leave hundreds of them in a hot path and measure nothing.
Now put an expression inside it. This is a disabled debug call, five ways, 300,000 iterations:
Disabled debug call |
ns per call |
|---|---|
log.debug(\cart ${expensive(i)}`)` |
1,859 |
log.debug(expensive(i)) |
1,855 |
log.debug(() => \cart ${expensive(i)}`)` |
7.4 |
if (log.enabled('debug')) log.debug(...) |
4.4 |
if (MIN <= LEVELS.debug) log.debug(...) |
4.6 |
The level check happens inside the function. JavaScript evaluates arguments before the call, so expensive() runs, the string is built, and then the logger throws it away. 420× the cost of the guarded version, for output nobody will ever see.
That multiplier is not a constant — it is the cost of whatever you interpolated. Re-running with a cheaper expression gave 251.5 ns against 4.0 ns, still 63×. The ratio scales with how expensive the argument is; the shape of the mistake does not change.
Twenty of those in a request handler is 37 microseconds of pure waste per request, permanently, in production, at a log level you turned off precisely so this would not happen. Pass a function or check the level first. Both are effectively free.
Does stdout block the event loop?
Node's stdout is synchronous to files and to TTYs, and asynchronous to pipes on macOS. That is the documented rule and it is worth measuring rather than trusting, because "asynchronous" turns out not to mean "free".
A burst of 50,000 lines (3.95 MB) written in one tick, with a 1 ms interval timer measuring how long the loop was unavailable:
| stdout goes to | burst wall time | buffered after the loop | max loop lag |
|---|---|---|---|
| a file | 77.5 ms | 0 bytes | 76.8 ms |
/dev/null |
37.4 ms | 0 bytes | 36.7 ms |
| a pipe, fast reader | 34.9 ms | 0 bytes | 34.3 ms |
| a pipe, slow reader | 4.8 ms | 3,884,509 bytes | 15.2 ms |
| a TTY (pty, 20k lines) | 20.8 ms | 0 bytes | 20.1 ms |
container, json-file |
17.2 ms | 3,153,127 bytes | 16.3 ms |
container, docker run -t |
106.6 ms | 0 bytes | 106.0 ms |
Read the middle column. Where it says 0 bytes, the write completed inside the loop — the process sat still for the whole burst. To a file, that is 76.8 ms during which your server accepts nothing, answers nothing and fails no health check, because the health check endpoint cannot run either.
The pipe with a slow reader is the case people mean by "asynchronous", and it is not better, it is different. The burst returned in 4.8 ms and left 3.9 MB of log sitting in the process's own memory, which took 2,857.8 ms to drain. Nothing blocked; the log queue simply became an unbounded memory leak with a slow consumer at the end of it. Under a real stall you get the RSS growth, not the pause.
The single worst line in the table is docker run -t. Allocating a TTY makes every write synchronous and slow: 2,131 ns per line against 343–489 ns for the same container without -t, and a 106 ms stall on the burst. People add -t because it makes docker logs colourful. It is the most expensive flag in this article.
What does logging cost a real server?
The per-call numbers are abstract. Here is a Node 23 HTTP server returning a 9-byte JSON body, driven by eight keep-alive connections for five seconds, writing 0, 1 or 5 JSON log lines per request:
| Log lines per request | req/s | p50 | p99 | log written in 5 s |
|---|---|---|---|---|
| 0 | 68,722 | 0.10 ms | 0.27 ms | 0 |
| 1 | 67,554 | 0.10 ms | 0.31 ms | 47.3 MB |
| 5 | 46,059 | 0.14 ms | 0.42 ms | 161.2 MB |
One line per request costs 1.7% of throughput. Five costs 33%.
Read that carefully. This handler does nothing, so logging is most of the work; a handler spending 37 ms on a database query would lose a fraction of a percent. The number that generalises is the byte column: one log line per request, at 67,554 requests per second, produced 47.3 MB in five seconds. CPU is rarely what logging costs you. Bytes are.
What does structured cost over plain?
Same record, four shapes, 300,000 iterations:
| Shape | bytes/line | build ns | build + write ns |
|---|---|---|---|
| plain text | 67 | 15.1 | 1,547 |
| plain text + request id | 94 | 17.8 | 1,575 |
| JSON, 8 fields | 144 | 276 | 1,908 |
| JSON, 8 fields + trace context | 257 | 389 | 2,130 |
JSON costs 2.15× the bytes of the equivalent plain line and about 23% more wall time per line. Adding a request id to a plain line costs 27 bytes and 3 ns — that is the cheapest useful thing in this article, and it is what makes a log searchable at all. Adding full W3C trace context (trace_id plus span_id) costs 113 bytes, nearly doubling the line again.
The honest trade: structured logging is worth its 2.15× because grep on unstructured logs stops working the moment two services interleave. But it is a 2.15× on the thing that actually runs out, which is disk.
How long until logs fill the disk?
Docker's default json-file driver wraps every line in its own JSON envelope with a timestamp. Measured, not estimated — 100,000 lines emitted, then the container's log file inspected on disk:
| App writes | raw bytes | on-disk bytes | per line | multiplier |
|---|---|---|---|---|
| plain, 79 B/line | 7,900,000 | 14,900,153 | 149.0 | 1.89× |
| JSON, 144 B/line | 14,400,000 | 23,800,085 | 238.0 | 1.65× |
The envelope is 70 bytes: {"log":"…","stream":"stdout","time":"2026-09-04T17:51:48.420948591Z"}. JSON lines pay 24 bytes more than that, exactly one byte for each of the 24 double quotes the driver has to escape. Your structured log line is stored inside another structured log line, and you pay for both.
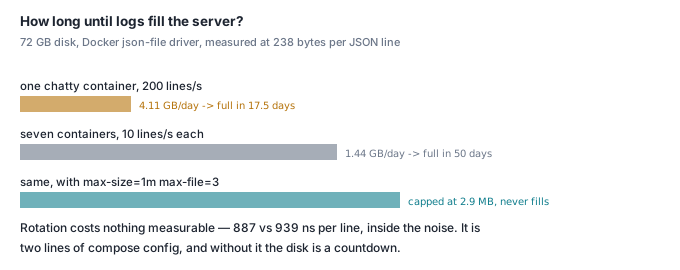
A container emitting 200 JSON lines per second for 20 seconds produced 951,676 bytes of container log — 47,584 bytes per second, 4.11 GB per day. Against the CST server's 72 GB disk:
| App log rate | plain | JSON | days to fill 72 GB (JSON) |
|---|---|---|---|
| 1 line/s | 0.013 GB/day | 0.021 GB/day | 3,501 |
| 10 lines/s | 0.129 GB/day | 0.206 GB/day | 350 |
| 50 lines/s | 0.644 GB/day | 1.028 GB/day | 70 |
| 200 lines/s | 2.575 GB/day | 4.113 GB/day | 17.5 |
| 1,000 lines/s | 12.87 GB/day | 20.56 GB/day | 3.5 |
Seven containers at a sleepy 10 lines per second each is 1.44 GB per day and a full disk in 50 days. That is the shape of the problem: nothing looks wrong on any given day, and then a deploy fails at 03:00 because /var/lib/docker has no room, taking down every service on the host at once.
Rotation is the fix and it is free. With --log-opt max-size=1m --log-opt max-file=3, the same 14,900,153-byte log became three files totalling 2,882,200 bytes — capped, permanently. Throughput over 300,000 lines, three runs each:
| Driver | ns per line |
|---|---|
--log-driver none |
586 / 647 / 904 |
json-file (default) |
939 / 953 / 987 |
json-file + max-size=1m |
887 / 992 / 1,046 |
Rotation is inside the noise. There is no performance argument for leaving container logs unbounded. Put this in /etc/docker/daemon.json so it applies to every container, including the ones you start by hand at 03:00:
{
  "log-driver": "json-file",
  "log-opts": { "max-size": "10m", "max-file": "3" }
}
Twelve containers, 30 MB each, 360 MB total, worst case, forever.
What does sampling buy, and what does it cost?
Logging 1 in N of a high-volume event, measured per event including the skipped ones:
| Rate | ns per event | bytes per million events |
|---|---|---|
| every event | 2,102 | 144,000,000 |
| 1 in 10 | 185 | 14,400,000 |
| 1 in 100 | 19 | 1,440,000 |
A 110× reduction in CPU and volume for two lines of code. The cost is not subtle: at 1 in 100 you see a specific rare request with probability 0.01, and the request you are hunting is rare because it is the failure. The rule that survives contact with an incident is "log all errors, sample the 200s".
The settings that matter
Five changes, in the order they pay off:
max-sizeandmax-filein/etc/docker/daemon.json. Free, measured, and it is the one that stops the outage.- Never
docker run -tfor a service. 2,131 ns per line versus 343, and a 106 ms event-loop stall on a burst. - Guard or defer every argument to a disabled log call. 1,859 ns versus 4.4 ns.
process.stdout.writeof a pre-serialised line, notconsole.log(obj)— 1,999 ns versus 3,841, and output a parser can read.- Sample the boring events, never the errors.
None of this needs a logging library. Adopt one for the ergonomics — child loggers carrying a request id, redaction — knowing the write underneath still costs what it costs here.
Check it yourself
Two files. The first measures per-call cost by style; the second measures whether your stdout blocks. Node 18+, no dependencies.
// percall.js <case> <iterations>   results -> stderr, log output -> stdout
const kase = process.argv[2], N = Number(process.argv[3] || 200000);
const LEVELS = { info: 30, debug: 20 }, MIN = LEVELS.info;   // debug OFF
const rec = (i) => ({ level:'info', time:1757030400000+i, msg:'request completed',
  req_id:'01JX7QK3F2B8N4V6ZC9T5M0AWD', method:'POST', path:'/api/v1/invoices',
  status:200, dur_ms:37 });
const out = process.stdout;
const log = { debug(m, o) { if (MIN > LEVELS.debug) return; out.write(m + JSON.stringify(o) + '\n'); } };
// the argument the disabled debug call is about to throw away
const user = { id: 4812, email: 'ops@example.com', roles: ['admin','billing'], tz: 'Europe/Paris' };
const items = Array.from({ length: 12 }, (_, i) => ({ sku: 'SKU-' + i, qty: i % 4, price: 9.99 + i }));
const expensive = (i) => JSON.stringify({ user, items, attempt: i });
let sink = 0;
const cases = {
  'disabled-branch':  (i) => { if (MIN <= LEVELS.debug) out.write('x'); },
  'disabled-call':    (i) => log.debug('done', rec(i)),
  'eager-template':   (i) => log.debug(`cart ${expensive(i)}`),
  'lazy-thunk':       (i) => log.debug(() => `cart ${expensive(i)}`),
  'stringify-only':   (i) => { sink += JSON.stringify(rec(i)).length; },
  'write-plain':      (i) => out.write(`info req=${i} status=200 dur=37ms\n`),
  'write-json':       (i) => out.write(JSON.stringify(rec(i)) + '\n'),
  'console-string':   (i) => console.log(`info req=${i} status=200 dur=37ms`),
  'console-object':   (i) => console.log(rec(i)),
};
const fn = cases[kase]; if (!fn) { console.error('cases: ' + Object.keys(cases)); process.exit(1); }
for (let i = 0; i < Math.min(5000, N); i++) fn(i);
const t0 = process.hrtime.bigint();
for (let i = 0; i < N; i++) fn(i);
const t1 = process.hrtime.bigint();
process.stderr.write(`${kase}\t${(Number(t1 - t0) / N).toFixed(1)} ns/call\n`);
// blocking.js <lines>  -- does your stdout stall the event loop?
const M = Number(process.argv[2] || 50000), out = process.stdout;
const kind = out.isTTY ? 'TTY' : (out._type || 'unknown');
const line = 'info req=01JX7QK3F2B8N4V6ZC9T5M0AWD status=200 dur_ms=37 path=/api/v1/invoices\n';
let maxLag = 0, last = process.hrtime.bigint();
const timer = setInterval(() => {
  const now = process.hrtime.bigint();
  maxLag = Math.max(maxLag, Number(now - last) / 1e6 - 1); last = now;
}, 1);
setTimeout(() => {
  last = process.hrtime.bigint();
  const t0 = process.hrtime.bigint();
  for (let i = 0; i < M; i++) out.write(line);
  const t1 = process.hrtime.bigint();
  const buffered = out.writableLength;
  out.write('', () => setTimeout(() => {
    clearInterval(timer);
    process.stderr.write(`dest=${kind} lines=${M} burst=${(Number(t1-t0)/1e6).toFixed(1)}ms ` +
      `buffered_after_loop=${buffered} max_loop_lag=${maxLag.toFixed(1)}ms\n`);
  }, 30));
}, 120);
# per-call cost, three destinations
for c in disabled-branch disabled-call eager-template lazy-thunk stringify-only \
         write-plain write-json console-string console-object; do
  node percall.js $c 500000 > out.log            # stdout is a file
done
node percall.js write-plain 500000 | cat > /dev/null   # stdout is a pipe

# does it block? file, fast pipe, slow pipe, tty
node blocking.js 50000 > burst.log
node blocking.js 50000 | cat > /dev/null
node blocking.js 50000 | sh -c 'sleep 3; cat > /dev/null'   # the buffering case
script -q /dev/null node blocking.js 20000 | grep -a dest=  # a real pty

# what Docker charges you per line, and what rotation caps it at
docker run --name logsize -v "$PWD":/w:ro -w /w node:23-alpine \
  node -e 'for(let i=0;i<100000;i++)process.stdout.write("x".repeat(78)+"\n")' >/dev/null
docker logs logsize | wc -c                                  # 7,900,000 raw
docker run --rm -v /var/lib/docker:/vd:ro alpine stat -c '%s' \
  "$(docker inspect --format '{{.LogPath}}' logsize | sed s#/var/lib/docker#/vd#)"
docker rm -f -v logsize; rm -f out.log burst.log
Run the last two on your own server. Divide free disk by the bytes-per-second they imply and you have the date your host runs out of room; if it is inside a year, the daemon.json above moves it to never.
Logging is not the only default that is quietly unbounded — see also the timeout you forgot and what happens when a large response is buffered instead of streamed. The setting nobody chose is the one that decides what the server does at its worst moment.