Why is COUNT(*) so slow in Postgres?
Measured on Postgres 16 at ten million rows. An exact COUNT(*) reads every visible tuple - 113,637 buffers, about 26 nanoseconds a row - and no index removes that. The estimate everyone reaches for, reltuples, was 23% wrong at the moment I needed it; the one nobody mentions was 0.008% wrong.

An exact COUNT(*) over 10,000,000 rows cost 111 ms warm and about 300 ms cold on Postgres 16, and nothing makes it cheaper, because Postgres has to look at every visible tuple — 113,637 buffers, every time, forever. That is roughly 26 nanoseconds per row on one core. The only escape is to stop asking for an exact number, and reltuples is the wrong estimate to reach for: pg_stat_user_tables.n_live_tup answered in 1.4 ms and stayed within 0.008% of the truth at every point I measured, while reltuples was 23% wrong at the same instant.
The short answer
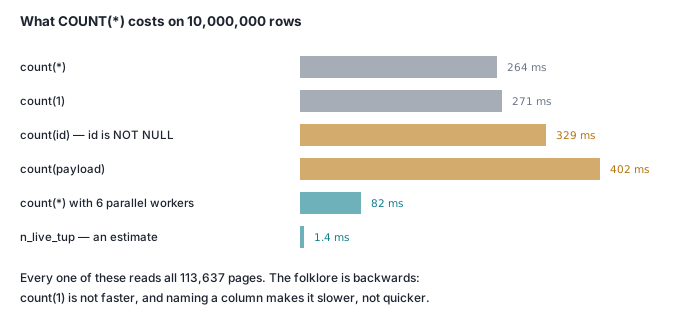
COUNT(*)on Postgres 16 reads the whole table, always. Ten million rows, 888 MB heap:Seq Scan,Buffers: shared hit=113637warm andshared read=113637cold. Under MVCC visibility is per-transaction, so there is no counter to look up.- 111 ms warm at Postgres 16's default two parallel workers, 264 ms with parallelism off, 82 ms with five workers, 283–441 ms cold. Linear in rows: 3,000,000 rows took 78–91 ms serially, the same 26 ns a row.
COUNT(1)is not faster thanCOUNT(*)— andCOUNT(id)is 24% slower. Medians of eleven runs: 263.9, 271.2 and 328.5 ms, on identical plans. Naming a column makes Postgres deform the tuple to check it for NULL, even on aNOT NULLprimary key.- An index does not fix an unfiltered count. A deduplicated 66 MB btree read 8,437 buffers instead of 113,637 — 13.5x less IO — and got slower warm, 254.5 ms against 232.0 ms. Cached counting is CPU-bound, not IO-bound.
- One
UPDATEtouching one row in ten took the visibility map from 113,637 all-visible pages to zero, and the same index-only count went from 8,437 buffers to 484,205 with 11,000,000 heap fetches. reltuplesdrifts by exactly your churn rate. After inserting 3M rows into a 9.9M-row table it read 23.2% low, theEXPLAINestimate 10.0% low, andn_live_tup0.008% high.
What was measured, and on what
Postgres 16.15 (Debian, aarch64) in Docker 29.5.2 on an Apple M3 laptop — 8 cores, 16 GB RAM, macOS 26.4.1, an 8 GB / 8 vCPU Docker VM — with shared_buffers=2GB, autovacuum=off so nothing moved under the measurements, and max_parallel_workers_per_gather=2, Postgres 16's own default. These are indicative figures from a laptop in Docker, not a lab benchmark. The machine was not idle throughout, so every timing is the median of seven to eleven runs with min and max quoted.
One table, ten million rows:
CREATE TABLE orders (
  id bigint PRIMARY KEY, status text, created_at timestamptz,
  amount numeric(10,2), payload text);
After VACUUM ANALYZE: 888 MB heap, 113,637 pages, 100% all-visible, plus a 214 MB primary key. status holds paid (6,000,000 rows), pending (2,500,000), shipped (1,400,000) and refunded (100,000). Cold means the container restarted and the Docker VM's page cache dropped.
What does COUNT(*) actually do?
It reads every page of the table and inspects every tuple on it. The plan says so plainly:
 Aggregate (actual rows=1 loops=1)
   Buffers: shared hit=113637
   ->  Seq Scan on orders (actual rows=10000000 loops=1)
         Buffers: shared hit=113637
113,637 buffers is exactly the table — every page, no exceptions. Postgres cannot keep a row counter the way MyISAM did, because under MVCC there is no single answer: your transaction may see rows another cannot, and a deleted row is physically present until vacuum.
10,000,000 rows, SELECT count(*) |
buffers | time (median, min–max) |
|---|---|---|
Warm, max_parallel_workers_per_gather=0 |
shared hit=113637 |
263.9 ms (258.8–271.1) |
| Warm, default 2 workers | shared hit=113637 |
110.8 ms (107.0–132.1) |
| Warm, 5 workers | shared hit=113637 |
81.8 ms (79.3–84.3) |
Warm, from a psql client over TCP |
— | 119.4 ms (117.2–149.7) |
| Cold, serial | shared read=113637 |
421.9 ms (403.4–440.7) |
| Cold, 2 workers | shared read=113637 |
301.0 ms (283.8–345.9) |
Unlike SELECT *, where the bill arrives at serialization, a count returns one row, so the client sees what the server spent.
A warning if you are reading plans to find a slow query: EXPLAIN ANALYZE lies badly here, because its per-tuple clock reads cost more than the counting does. The same serial count reported 607.6–670.6 ms under EXPLAIN (ANALYZE), 258.1–348.7 ms under EXPLAIN (ANALYZE, TIMING OFF), and actually took 233–300 ms. The instrumentation is 2.4x the query.
Is COUNT(1) faster than COUNT(*)?
No — but the modern correction, "they are all identical, stop worrying", is wrong too. Six to eleven runs each, serial, medians:
| Serial count over 10,000,000 rows | median | min | vs count(*) |
|---|---|---|---|
count(*) |
263.9 ms | 258.8 | — |
count(1) |
271.2 ms | 267.2 | +2.8% |
count(id) — bigint, column 1, NOT NULL |
328.5 ms | 317.9 | +24.5% |
count(status) — text, column 2 |
324.6 ms | 322.9 | +23.0% |
count(payload) — text, column 5 |
402.1 ms | 387.0 | +52.4% |
Three interleaved batches reproduced the ordering every time, on plans that are identical — Aggregate over Seq Scan in all five cases — so nothing in EXPLAIN will tell you this.
The mechanism is tuple deforming. count(*) and count(1) never look inside the row. count(col) counts non-NULL values, so Postgres must extract that attribute, walking the tuple from the first column to the one you named — which is why the cost rises with column position.
The part I did not expect: id is the primary key and therefore NOT NULL, so count(id) is provably equal to count(*), and Postgres 16 does not make that rewrite. It pays for the NULL check anyway.
Does an index make COUNT(*) faster?
Much less than you would hope, and on a cached table it makes it slower.
Postgres can answer a count from an index alone when the index covers the query and the pages are all-visible. A btree on status — four distinct values over ten million rows, so deduplication packs them into posting lists — is 66 MB against the heap's 888 MB. The planner picks it unprompted:
| Warm, serial, 10,000,000 rows | buffers | median | min |
|---|---|---|---|
Index Only Scan on the 66 MB status index |
8,437 | 254.5 ms | 253.9 |
Seq Scan over the 888 MB heap |
113,637 | 232.0 ms | 231.0 |
Index Only Scan on the 214 MB primary key |
27,329 | 306.6 ms | 300.1 |
Thirteen and a half times less IO bought minus 9% of performance. Once the data is in shared_buffers a count is not an IO problem; it is ten million iterations of a loop, and a btree leaf packs tuples densely but costs more per tuple to walk.
Cold, with the container restarted and the VM page cache dropped, the index finally earns something: 318.3 / 320.5 / 323.6 ms against 410.1 / 457.5 ms for the sequential scan. About 1.3x — a ratio that would grow on storage slower than this laptop's NVMe, which streamed 888 MB in roughly 410 ms.
What does the visibility map have to do with COUNT?
Everything. This is what turns a good plan into a bad one with no query change.
An index-only scan is only index-only for pages the visibility map marks all-visible; for any other page it fetches the heap tuple to check visibility, a random read per row. So I took the freshly vacuumed table and ran one update against one row in ten, UPDATE orders SET payload = md5(payload) WHERE id % 10 = 0:
| State | all-visible pages | Plan chosen | Buffers | Heap Fetches | median |
|---|---|---|---|---|---|
| Freshly vacuumed | 113,637 / 113,637 | Index Only Scan |
8,437 | 0 | 255.0 ms |
| After updating 10% of rows | 0 / 125,000 | Seq Scan |
125,000 | — | 277.2 ms |
| Same, index-only forced | 0 / 125,000 | Index Only Scan |
484,205 | 11,000,000 | 825.8 ms |
After VACUUM (1.1 s) |
125,000 / 125,000 | Index Only Scan |
9,205 | 0 | 256.5 ms |
One update touching a tenth of the rows took the all-visible page count from 113,637 to zero. Not to 90% — to nothing, because the rows were scattered evenly and one modified row unsets a whole page's bit. The index-only scan then did 11,000,000 heap fetches (10M live rows plus 1M dead index entries) and read 57x the buffers.
The planner switched to a sequential scan on its own, but not because it knew: pg_class still claimed relallvisible = 113637, since only VACUUM and ANALYZE update it. It switched because the sequential scan simply costed lower — 235,000 against 241,142. Where the index wins that comparison you get the 484,205-buffer plan instead. An index-only count is a benefit you rent from autovacuum, and with scattered updates it disappears between vacuums.
How fast is a filtered count?
This is the case where an index is worth having, and by a lot. Serial, medians of seven:
SELECT count(*) WHERE status = … |
rows | no index | with (status) btree |
partial index |
|---|---|---|---|---|
'refunded' |
100,000 (1%) | 113,637 buf / 291.4 ms | 92 buf / 3.4 ms | 91 buf / 3.3 ms |
'shipped' |
1,400,000 (14%) | 113,637 buf / 331.0 ms | 1,185 buf / 36.2 ms | — |
'paid' |
6,000,000 (60%) | 113,637 buf / 391.2 ms | 5,057 buf / 157.2 ms | — |
86x on the rare value, and still 2.5x when the predicate matches 60% of the table — the opposite of the usual rule that an index stops paying past a few percent, because this count never visits the heap at all.
The partial index, CREATE INDEX … ON orders (status) WHERE status='refunded', is the result I got wrong: I expected it to be meaningfully faster. It is 704 kB against 66 MB, and it read 91 buffers against 92, in 3.3 ms against 3.4 ms — inside the noise. A partial index is not a speed optimisation for a count. It is a write-path one that happens to be equally fast: 88 pages to keep current instead of 8,463.
How wrong is reltuples?
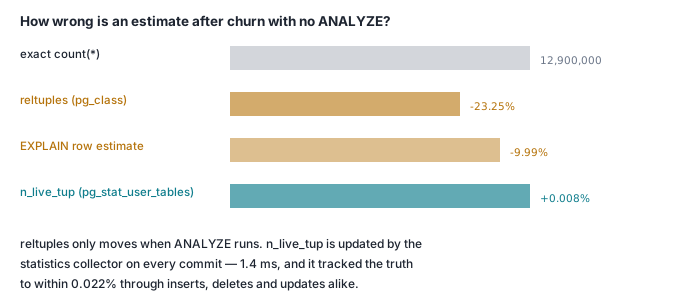
Wrong by exactly your churn rate. Three estimate sources, sampled at the same instant at each stage of a controlled sequence, against the truth:
| State | exact | reltuples |
EXPLAIN estimate |
n_live_tup |
|---|---|---|---|---|
Freshly VACUUM ANALYZEd |
10,000,000 | +0.002% | +0.002% | +0.002% |
+1M rows inserted, no ANALYZE |
11,000,000 | −9.09% | −9.09% | +0.001% |
ANALYZE |
11,000,000 | 0.000% | 0.000% | 0.000% |
−1.1M rows deleted, no VACUUM/ANALYZE |
9,900,000 | +11.11% | +11.11% | 0.000% |
ANALYZE, dead rows still present |
9,900,000 | +0.022% | +0.022% | +0.022% |
10% of rows UPDATEd, no VACUUM (separate run) |
10,000,000 | +0.001% | +10.00% | +0.001% |
+3M rows inserted, heap grew, no ANALYZE |
12,900,000 | −23.25% | −9.99% | +0.008% |
reltuples is a frozen snapshot of the last ANALYZE. It does not decay gracefully — it is exactly right at 05:00 and 23% wrong by lunchtime if you loaded 3M rows. Fresh, it is excellent: five consecutive ANALYZE runs on the 12,900,000-row table returned 12,900,008, 12,900,008, 12,899,969, 12,900,008 and 12,900,008 — a worst error of 39 rows, or 0.0003%.
The EXPLAIN row estimate is not reltuples. The planner scales it by the current page count — reltuples × relpages_now / relpages_at_analyze — which is really a guess about row width, and it fails both ways. Inserting into space a vacuum had freed grew no pages, so it under-counted by 9.09%. An UPDATE that changed no row count at all grew the heap 10% with dead tuples, so it over-counted by 10.00%.
n_live_tup was right every time. The cumulative statistics system tracks committed inserts and deletes as they happen on top of the last ANALYZE estimate, so it is a running total, not a stale sample. Worst error across the sequence: 0.022%, inherited from the ANALYZE beneath it. It is also correctly non-transactional — inside an open transaction that had inserted 50,000 rows, count(*) said 150,000 and n_live_tup said 100,000. One caveat: pg_stat_reset() wipes it.
Do more parallel workers help?
Up to a point, and the setting people reach for is not the one that binds. Medians of nine runs on the warm 888 MB table:
max_parallel_workers_per_gather |
workers launched | median | min–max |
|---|---|---|---|
| 0 | — | 256.9 ms | 242.5–290.3 |
| 1 | 1 | 153.4 ms | 143.6–188.4 |
| 2 (Postgres 16 default) | 2 | 110.8 ms | 107.0–132.1 |
| 4 | 4 | 96.5 ms | 87.3–103.3 |
| 6 | 5 | 81.8 ms | 79.3–84.3 |
| 8 | 5 | 82.1 ms | 79.9–84.9 |
8, with min_parallel_table_scan_size='1MB' |
7 | 75.5 ms | 72.0–83.0 |
Raising the setting from 6 to 8 did nothing, because the planner never asked for more than five workers. Its own cap comes from table size — roughly one extra worker per tripling beyond min_parallel_table_scan_size, which defaults to 8 MB — so an 888 MB table gets five. Lowering that GUC to 1 MB got seven workers and a further 8% on eight cores.
3.1x for six processes is a poor return, and it is charged to your connection ceiling: every one of those workers is a backend.
So when should you use an estimate?
Almost always, because the exact count costs 80x to 500x more and is usually stale by the time it reaches a browser anyway. Reading an estimate cost 0.5 ms for reltuples and 1.4 ms for n_live_tup, against 264 ms serial and 111 ms parallel for the truth.
The alternative people reach for — a counter row maintained by a trigger — is worse than counting, written the obvious way. A FOR EACH ROW trigger doing UPDATE counter SET n = n + 1 turned a 50,000-row insert from 45.2 / 48.2 / 82.9 ms into 10,650 / 10,708 / 13,544 ms, about 220x, because every row rewrites the same heap tuple. The statement-level form, using a transition table, is effectively free: 53.9 / 54.6 / 56.6 ms against 46.8 / 52.1 / 54.1 ms plain.
So, at ten million rows on this hardware:
- A user-facing "1,204,338 results" badge:
n_live_tup, 1.4 ms, well under 0.1% out. - A filtered count on a rare value: index it. 3.4 ms against 291 ms.
- An exact total you need often: a statement-level trigger onto a counter table. Never a row-level one.
- An exact total you need occasionally: just run
COUNT(*). Every trick to avoid it costs more than it saves.
Check it yourself
Ninety seconds, one container, nothing installed. It builds a 3,000,000-row table and reproduces five findings: what COUNT(*) reads, the COUNT(id) penalty, the index that does not help, the estimate drift, and the visibility map collapse.
docker run -d --name cite-cnt-demo --shm-size=1g \
  -e POSTGRES_PASSWORD=demo -e POSTGRES_DB=bench -p 55632:5432 \
  postgres:16 -c shared_buffers=1GB -c max_wal_size=4GB -c autovacuum=off
until docker exec cite-cnt-demo pg_isready -U postgres -d bench >/dev/null 2>&1; do sleep 1; done

docker exec -i cite-cnt-demo psql -U postgres -d bench -q <<'SQL'
CREATE EXTENSION pg_visibility;
CREATE TABLE orders (id bigint, status text, created_at timestamptz,
                     amount numeric(10,2), payload text) WITH (autovacuum_enabled=off);
INSERT INTO orders SELECT g,
  CASE WHEN g%100<60 THEN 'paid' WHEN g%100<85 THEN 'pending'
       WHEN g%100<99 THEN 'shipped' ELSE 'refunded' END,
  now(), round(((g%100000)/100.0)::numeric,2), md5(g::text)
FROM generate_series(1,3000000) g;
CREATE INDEX ix_status ON orders (status);
VACUUM ANALYZE orders;
SQL

t() { docker exec -i cite-cnt-demo psql -U postgres -d bench -tAq <<SQL
SET max_parallel_workers_per_gather=0;
SELECT clock_timestamp() t0 \gset
$2
SELECT rpad('$1',34) || lpad(round(extract(epoch from (clock_timestamp()- :'t0'::timestamptz))*1000,1)::text,8) || ' ms';
SQL
}

echo "== what COUNT(*) reads =="
docker exec cite-cnt-demo psql -U postgres -d bench -q \
  -c "SET max_parallel_workers_per_gather=0;" -c "SET enable_indexonlyscan=off;" \
  -c "EXPLAIN (ANALYZE, BUFFERS, COSTS OFF, TIMING OFF) SELECT count(*) FROM orders;"

echo "== is COUNT(1) or COUNT(id) faster? =="
for r in 1 2 3; do for q in "count(*)" "count(1)" "count(id)" "count(payload)"; do
  t "SELECT $q FROM orders" "SELECT $q FROM orders;" | tail -1; done; done

echo "== does an index help? =="
docker exec cite-cnt-demo psql -U postgres -d bench -q -c "SET max_parallel_workers_per_gather=0;" \
  -c "EXPLAIN (ANALYZE, BUFFERS, COSTS OFF, TIMING OFF) SELECT count(*) FROM orders;" | head -6
for r in 1 2; do
  t "index-only scan (66MB index)" "SELECT count(*) FROM orders;" | tail -1
  docker exec -i cite-cnt-demo psql -U postgres -d bench -tAq <<'SQL' | tail -1
SET max_parallel_workers_per_gather=0; SET enable_indexonlyscan=off;
SET enable_indexscan=off; SET enable_bitmapscan=off;
SELECT clock_timestamp() t0 \gset
SELECT count(*) FROM orders;
SELECT rpad('seq scan over the heap',34) || lpad(round(extract(epoch from (clock_timestamp()- :'t0'::timestamptz))*1000,1)::text,8) || ' ms';
SQL
done

echo "== how wrong is the estimate? =="
est() { docker exec cite-cnt-demo psql -U postgres -d bench -tAq -c "SELECT pg_stat_force_next_flush();" >/dev/null
  E=$(docker exec cite-cnt-demo psql -U postgres -d bench -tAq -c "EXPLAIN (FORMAT JSON) SELECT * FROM orders;" \
      | grep -o '"Plan Rows": [0-9]*' | head -1 | grep -o '[0-9]*')
  docker exec cite-cnt-demo psql -U postgres -d bench -tAq -c "
  WITH v AS (SELECT (SELECT count(*) FROM orders)::numeric c,
                    (SELECT reltuples::numeric FROM pg_class WHERE relname='orders') rt, $E::numeric es,
                    (SELECT n_live_tup::numeric FROM pg_stat_user_tables WHERE relname='orders') nl)
  SELECT rpad('$1',38) || ' exact=' || lpad(c::bigint::text,8)
      || '  reltuples=' || lpad(rt::bigint::text,8) || ' (' || lpad(round(100*(rt-c)/c,2)::text,7) || '%)'
      || '  EXPLAIN=' || lpad(es::bigint::text,8) || ' (' || lpad(round(100*(es-c)/c,2)::text,7) || '%)'
      || '  n_live_tup=' || lpad(nl::bigint::text,8) || ' (' || lpad(round(100*(nl-c)/c,2)::text,7) || '%)' FROM v;"
}
est "freshly ANALYZEd"
docker exec cite-cnt-demo psql -U postgres -d bench -q -c \
  "INSERT INTO orders SELECT 3000000+g,'paid',now(),1.00,md5(g::text) FROM generate_series(1,900000) g;"
est "after +900k rows, no ANALYZE"
docker exec cite-cnt-demo psql -U postgres -d bench -q -c "ANALYZE orders;"
est "after ANALYZE"

echo "== what churn does to the visibility map =="
docker exec cite-cnt-demo psql -U postgres -d bench -q -c "VACUUM ANALYZE orders;"
docker exec cite-cnt-demo psql -U postgres -d bench -q -c "SET max_parallel_workers_per_gather=0;" \
  -c "SELECT 'all-visible pages: '||all_visible||' of '||(pg_relation_size('orders')/8192) FROM pg_visibility_map_summary('orders');" \
  -c "EXPLAIN (ANALYZE, BUFFERS, COSTS OFF, TIMING OFF) SELECT count(*) FROM orders;" | grep -E "all-visible|Heap Fetches|Buffers|Scan"
docker exec cite-cnt-demo psql -U postgres -d bench -q -c "UPDATE orders SET payload=md5(payload) WHERE id % 10 = 0;"
docker exec cite-cnt-demo psql -U postgres -d bench -q -c "SET max_parallel_workers_per_gather=0;" -c "SET enable_seqscan=off;" \
  -c "SELECT 'all-visible pages: '||all_visible||' of '||(pg_relation_size('orders')/8192) FROM pg_visibility_map_summary('orders');" \
  -c "EXPLAIN (ANALYZE, BUFFERS, COSTS OFF, TIMING OFF) SELECT count(*) FROM orders;" | grep -E "all-visible|Heap Fetches|Buffers|Scan"

docker rm -f -v cite-cnt-demo
A run of exactly that on the machine described above printed:
== what COUNT(*) reads ==
 Aggregate (actual rows=1 loops=1)
   Buffers: shared hit=34091
   ->  Seq Scan on orders (actual rows=3000000 loops=1)
         Buffers: shared hit=34091
 Execution Time: 94.240 ms

== is COUNT(1) or COUNT(id) faster? ==
SELECT count(*) FROM orders           91.1 ms
SELECT count(1) FROM orders           82.8 ms
SELECT count(id) FROM orders          93.8 ms
SELECT count(payload) FROM orders    116.7 ms
SELECT count(*) FROM orders           78.5 ms
SELECT count(1) FROM orders           82.4 ms
SELECT count(id) FROM orders          94.4 ms
SELECT count(payload) FROM orders    117.0 ms
SELECT count(*) FROM orders           79.3 ms
SELECT count(1) FROM orders           82.6 ms
SELECT count(id) FROM orders          93.0 ms
SELECT count(payload) FROM orders    113.7 ms

== does an index help? ==
 Aggregate (actual rows=1 loops=1)
   Buffers: shared hit=2536
   ->  Index Only Scan using ix_status on orders (actual rows=3000000 loops=1)
         Heap Fetches: 0
index-only scan (66MB index)          80.7 ms
seq scan over the heap                75.5 ms
index-only scan (66MB index)          78.9 ms
seq scan over the heap                77.1 ms

== how wrong is the estimate? ==
freshly ANALYZEd               exact=3000000  reltuples=3000000 (  0.00%)  EXPLAIN=2999999 (  0.00%)  n_live_tup=2999999 (  0.00%)
after +900k rows, no ANALYZE   exact=3900000  reltuples=3000000 (-23.08%)  EXPLAIN=3900060 (  0.00%)  n_live_tup=3899999 (  0.00%)
after ANALYZE                  exact=3900000  reltuples=3899970 (  0.00%)  EXPLAIN=3899966 (  0.00%)  n_live_tup=3899966 (  0.00%)

== what churn does to the visibility map ==
 all-visible pages: 44319 of 44319
   ->  Index Only Scan using ix_status on orders (actual rows=3900000 loops=1)
         Heap Fetches: 0
         Buffers: shared hit=3241
 all-visible pages: 0 of 48750
   ->  Index Only Scan using ix_status on orders (actual rows=3900000 loops=1)
         Heap Fetches: 4290000
         Buffers: shared hit=157292
Note the estimate line: reltuples was 23.08% low while the EXPLAIN estimate was exactly right, because there the new rows were the same width as the old and the page-count scaling happened to land. That is the case against the EXPLAIN estimate in one line — when it is right, it is right by luck.
Where this goes next
Workflow Builder shows a run count on every flow page. It reads n_live_tup.